The February 2026 Middle Tennessee real estate market is defined by slower absorption, stable pricing, and rising inventory.
Transaction activity across the Nashville metropolitan region remains active, but homes are taking longer to convert from listed to closed. That extended timeline is pushing months of supply higher even as average sale prices remain relatively steady.
Financing remains the primary constraint. With 30 year mortgage rates holding in the 6% range, affordability continues to moderate demand. Buyers are not absent. They are more selective, more analytical, and more payment sensitive than in prior cycles.
This February 2026 Middle Tennessee housing market update analyzes inventory levels, closed price trends, months of supply, and county level divergence across Davidson, Williamson, Rutherford, and surrounding counties.
Key Takeaways February 2026
- Active inventory increased 11% year over year
- Months of supply rose to 5.89, up 20% from February 2025
- Closings declined 9% while contracts increased 5%
- Average sale price rose 1% while median price declined 1%
- County level divergence is widening across Middle Tennessee
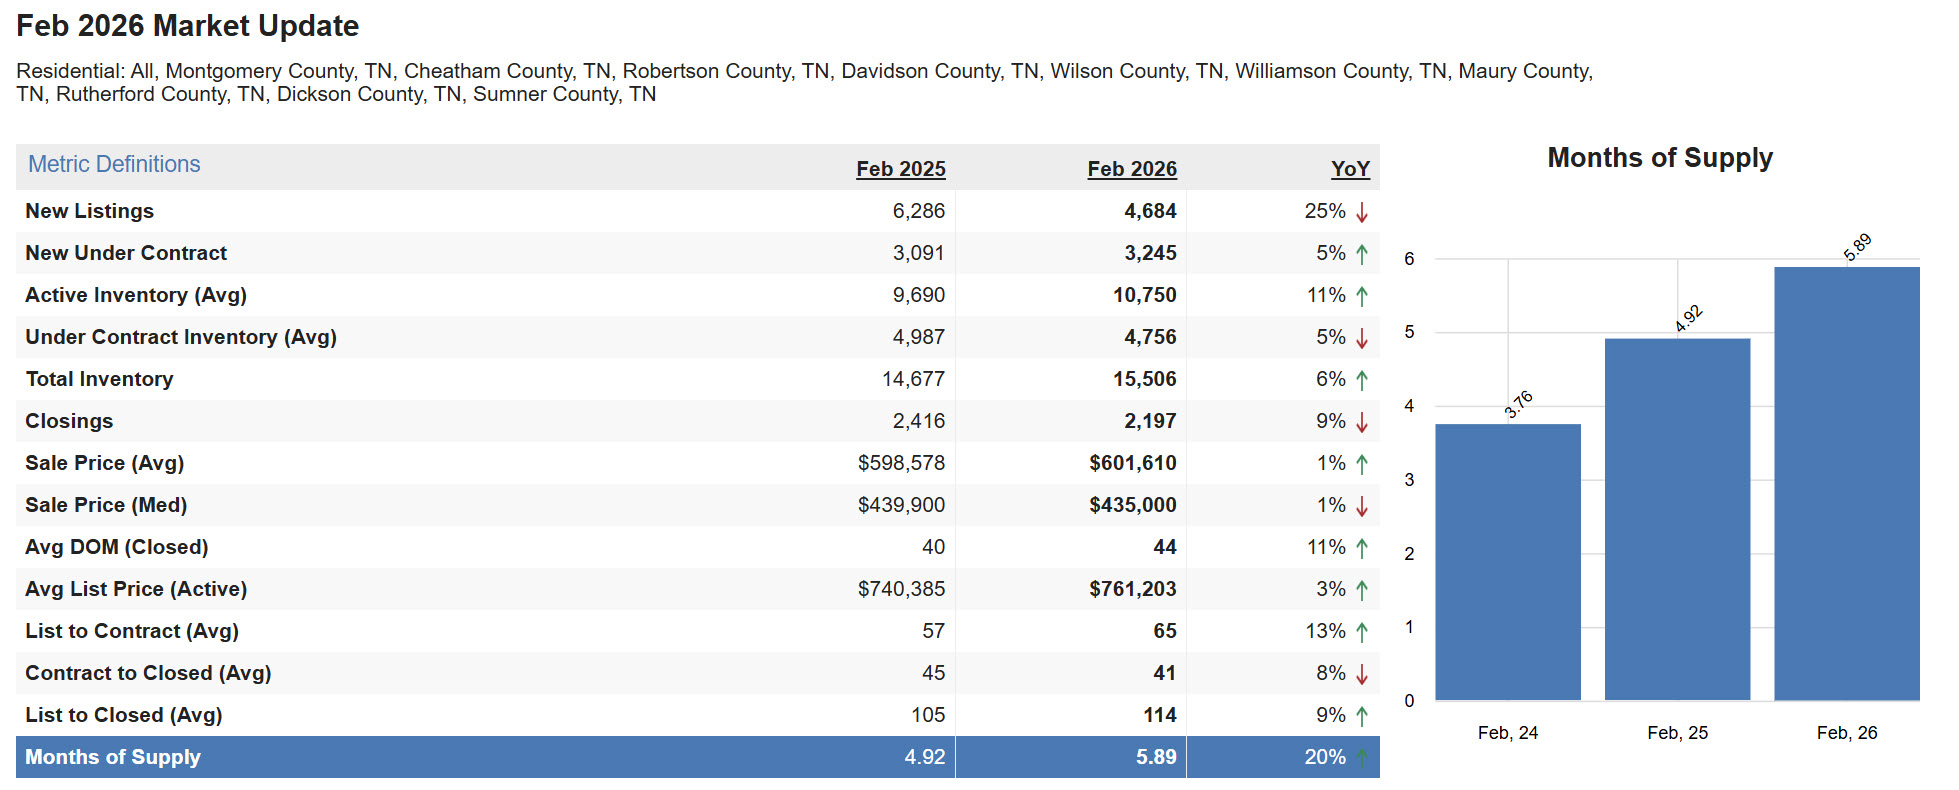
February 2026 Middle Tennessee Market Data
Across Montgomery, Cheatham, Robertson, Davidson, Wilson, Williamson, Maury, Rutherford, Dickson, and Sumner counties:
- New listings: 4,684, down 25% year over year
- New under contract: 3,245, up 5%
- Active inventory average: 10,750, up 11%
- Total inventory: 15,506, up 6%
- Closings: 2,197, down 9%
- Average days on market closed: 44, up 11%
- Months of supply: 5.89, up 20%
The most important signal is that new supply is down significantly, yet total inventory is higher.
That means listings are lingering longer before closing. The increase in contracts combined with a decline in closings suggests transaction volume is being pushed forward in time rather than eliminated entirely.
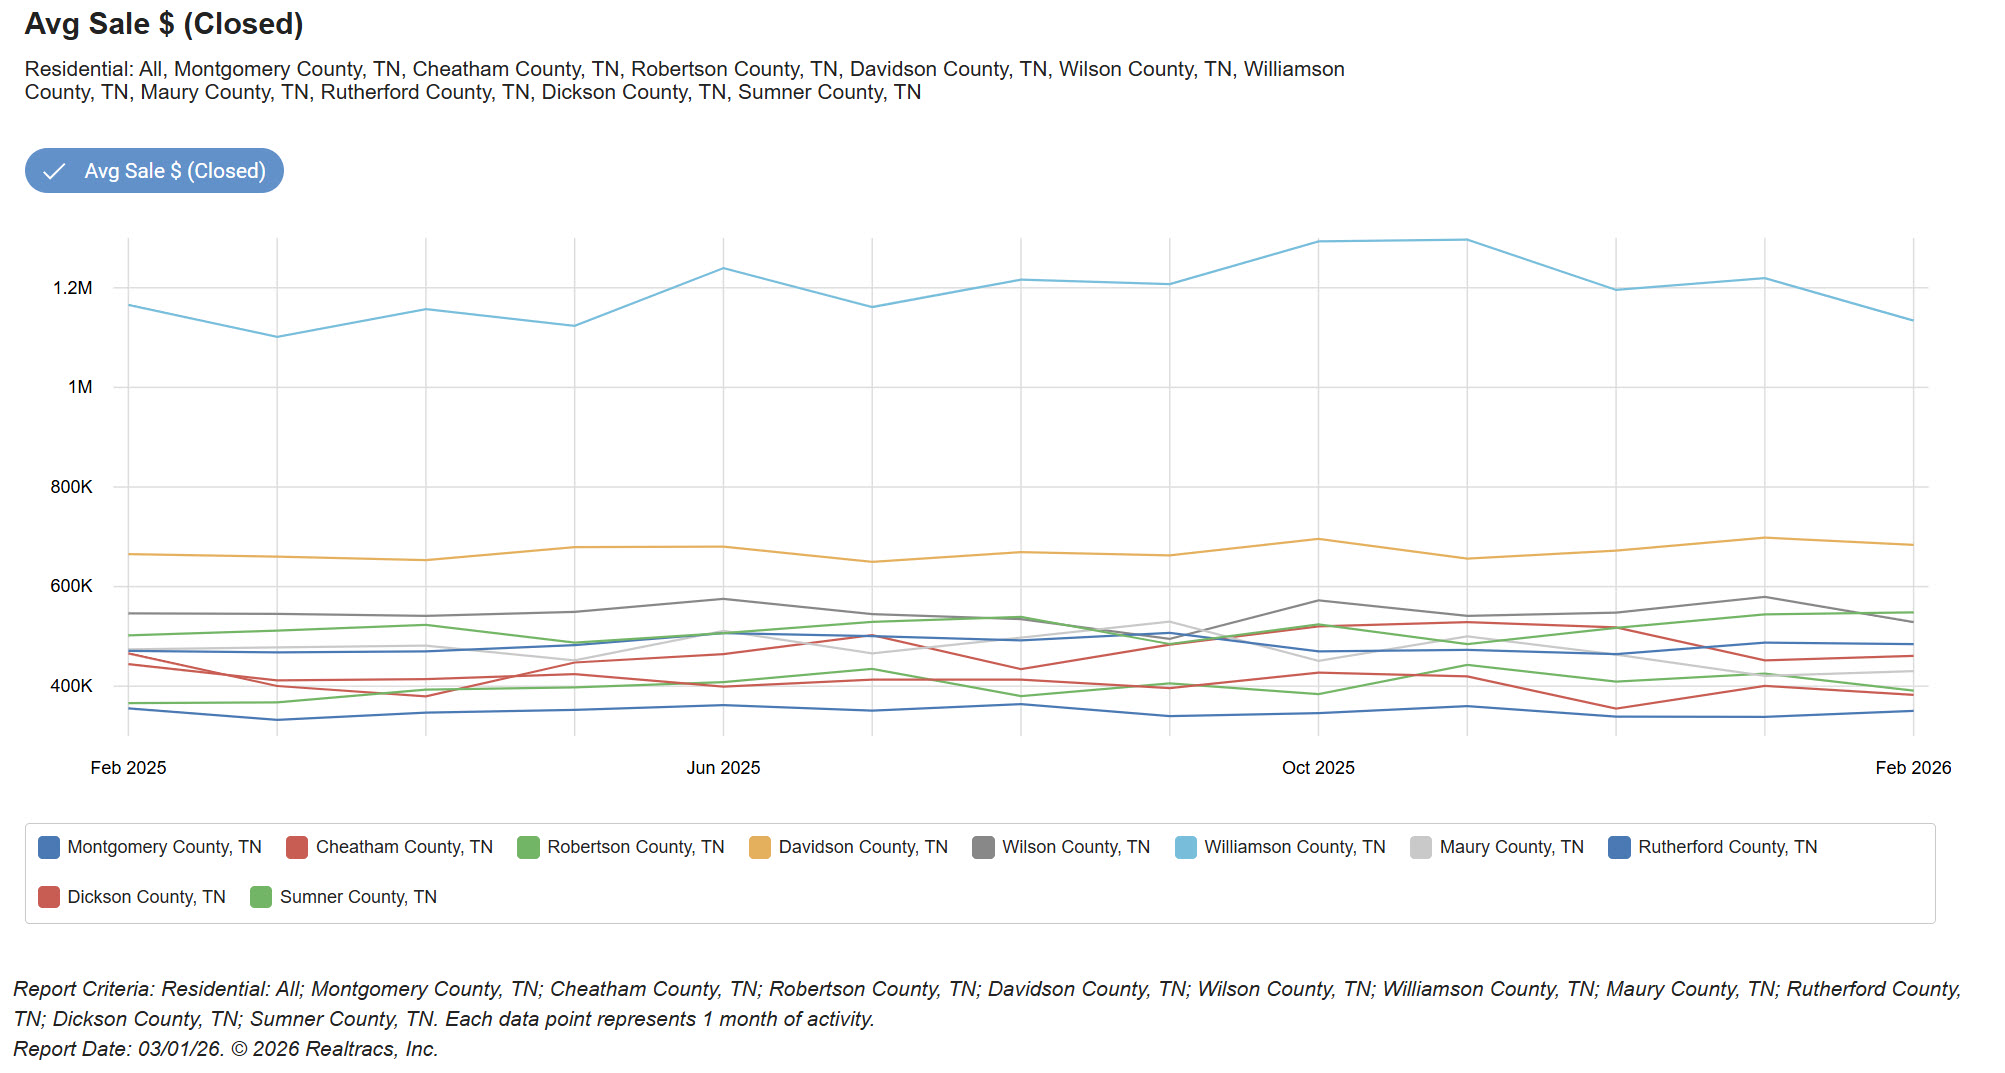
Closed Price Trends Over the Last 12 Months in Middle Tennessee
The 12 month average closed price trends across Middle Tennessee show stabilization rather than acceleration.
In counties such as Davidson, Williamson, Wilson, and Rutherford, pricing has moved within tighter bands compared to the sharp appreciation cycles of 2021 and 2022. Month to month volatility exists, but broad directional momentum has flattened.
This range bound behavior is consistent with an affordability constrained environment. When mortgage rates remain materially higher than the pre 2022 era, price expansion slows even when underlying demand remains intact.
Importantly, there is no evidence of broad based price deterioration. The February 2026 data shows:
- Average sale price up 1% year over year
- Median sale price down 1% year over year
That is not a reversal cycle. It is a consolidation phase. For buyers, this means improved negotiation leverage. For sellers, it means pricing precision is critical. For investors, it means underwriting must assume modest appreciation rather than rapid expansion.
County Level Divergence Across the Nashville Region
Middle Tennessee is no longer behaving as a single unified housing market. County level performance shows meaningful variation.
Davidson County
Average sale price: $683,569
Median price: $480,000
Months of supply: 6.64
Williamson County
Average sale price: $1,134,105
Median price: $942,500
Months of supply: 5.43
Rutherford County
Average sale price: $484,629
Median price: $425,000
Months of supply: 4.52
Robertson County
Average sale price: $391,028
Median price: $358,783
Months of supply: 7.43
Some counties are operating near balanced conditions. Others are leaning toward buyer advantage. Commute patterns, price points, and new construction exposure are creating segmentation inside the broader Nashville metro area. This divergence is also reflected in our broader Nashville real estate market analysis, where county level segmentation continues to widen.
Broad statements about “the Nashville market” are becoming less useful. Micro markets now matter more.
What Higher Months of Supply Really Means in Middle Tennessee
Months of supply in Middle Tennessee rose to 5.89 in February 2026, up 20% year over year. That number alone does not signal a price correction. It signals slower absorption.
Months of supply measures how long it would take to sell current inventory at the current sales pace. When that number rises, it typically reflects either increasing listings, slowing closings, or both. In February 2026, new listings were down 25% year over year, yet total inventory still increased. That tells us the issue is speed, not oversupply.
Across the Nashville metro area, buyers are not disappearing. They are underwriting more carefully. Payment sensitivity remains high with mortgage rates in the 6% range. That shifts leverage slightly toward buyers without creating distress conditions. The pricing spread reinforces this point. Average list price for active homes rose 3% year over year, while median sale price declined 1%. Sellers are still testing price ceilings. Buyers are enforcing market discipline.
In practical terms, well positioned homes in Davidson County, Williamson County, and parts of Rutherford County are still moving. Homes priced ahead of recent comparable sales are sitting longer and requiring concessions. Higher months of supply in 2026 reflects negotiation, not collapse.
Outlook for the Rest of 2026 in Middle Tennessee Real Estate
Months of Supply Likely Remains Elevated
Unless mortgage rates decline materially from the 6% range, months of supply across Middle Tennessee will likely remain in the 5 to 7 month range, with some counties such as Robertson and Maury exceeding that threshold periodically.
If rates soften meaningfully, absorption could accelerate quickly given that contract activity is already holding firm.
Pricing Divergence Widens Across Counties and Price Bands
The gap between prime inventory and average inventory will widen. Homes with strong location fundamentals, functional layouts, and realistic pricing will continue to transact in Davidson and Williamson Counties. Properties that are dated, overpriced, or located in slower absorption corridors will require price adjustments or concessions.
Expect:
- More seller paid closing costs
- More inspection negotiations
- More price reductions before contract
But not necessarily broad price collapse. This reflects normalization rather than systemic distress.
County Segmentation Becomes the Defining 2026 Theme
Middle Tennessee is fragmenting into micro markets.
Watch closely:
- New construction heavy corridors where builder incentives are increasing
- Commute sensitive counties where gas and financing costs influence decisions
- Higher price segments exposed to jumbo loan sensitivity
Davidson County may behave differently than Rutherford County. Williamson County will continue to operate under its own supply dynamics. Outer ring counties may experience higher months of supply with slower velocity. The defining characteristic of the 2026 Middle Tennessee housing market is selectivity.
- For buyers, this environment creates negotiation opportunity.
- For sellers, pricing accuracy matters more than momentum.
- For investors, underwriting should assume modest appreciation and stable but selective demand across the Nashville region.
This is not a distressed environment. It is a disciplined one.