January data shows the Middle Tennessee housing market has entered a clear shift in market dynamics. The market moved toward buyers even though fewer new listings came to market. That combination matters because it signals slowing absorption rather than a surge of supply.
This shift is showing up most clearly in time on market, negotiation leverage, and county-level divergence rather than across-the-board price declines.
Key Market Signals
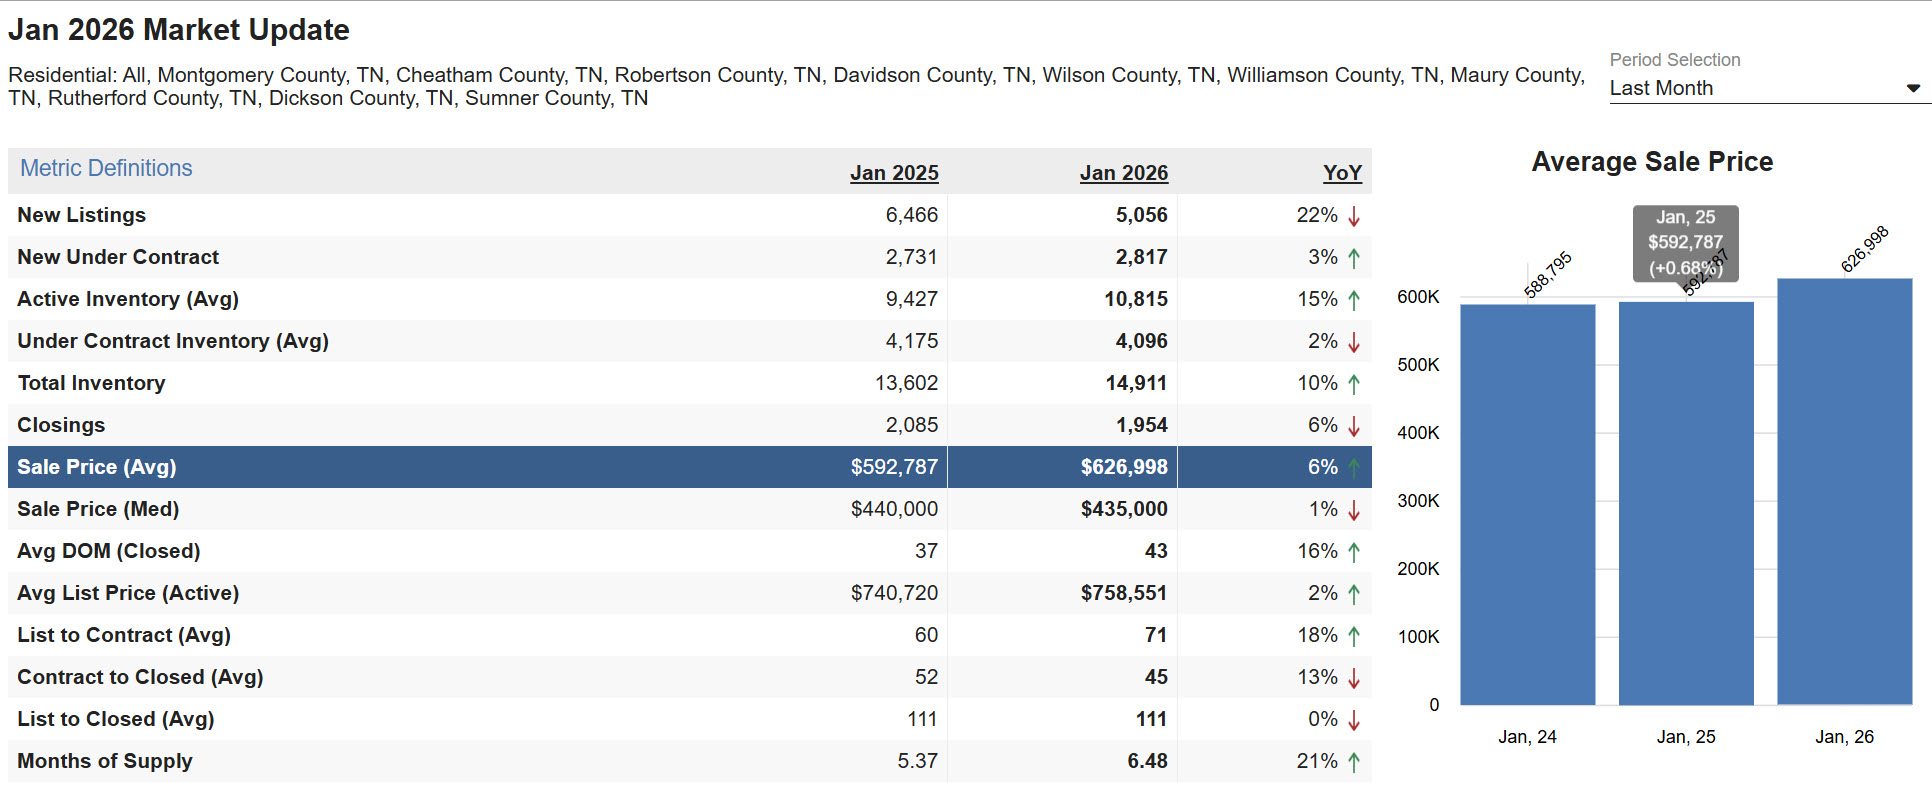
- New listings fell 22% year over year while active inventory rose 15%.
- Months of supply increased to 6.48, signaling slower absorption.
- Buyer leverage improved due to longer selling timelines, not excess new supply.
- Market conditions diverged sharply by county and price tier.
Inventory Trends in the Middle Tennessee Housing Market
Across the counties analyzed, new listings declined from 6,466 to 5,056, a 22% year-over-year drop. At the same time, active inventory increased from 9,427 to 10,815, up 15%. Months of supply rose from 5.37 to 6.48, an increase of 21%.
That combination is the tell. When fewer homes are coming on the market but inventory still rises, it usually means homes are taking longer to sell or more listings are lingering and stacking up. The slowdown is not coming from sellers flooding the market. It is coming from reduced absorption.
Time Metrics Confirm Buyer Leverage Improved
The time data reinforces what inventory already suggests.
Average days on market increased from 37 to 43, up 16%. List to contract time rose from 60 to 71 days, an 18%increase. Homes are taking longer to attract offers and longer to reach contract once listed.
The net effect is buyer leverage. Buyers gained negotiating power not because sellers rushed to list, but because existing inventory cleared more slowly.
Contract Activity Improved but Closings Lagged
Demand showed improvement at the shopping stage but not yet in closed sales.
New homes going under contract rose slightly from 2,731 to 2,817, a 3% year-over-year increase. Closings fell from 2,085 to 1,954, down 6%.
This is a classic pipeline pattern. Closings reflect decisions made weeks earlier, and longer timelines mean fewer contracts convert quickly into sales. Stabilizing contract activity does not immediately translate into higher closed volume when days on market are rising.
Prices Look Mixed Because the Market Is Split
Price data appears contradictory at first glance.
The average sale price rose from $592,787 to $626,998, up 6%. The median sale price declined slightly from $440,000 to $435,000, down 1%.
When the average rises but the median softens, it often reflects mix shift rather than broad pricing power. Higher-end and scarce submarkets can still post strong results, while the middle of the market faces payment pressure and negotiates harder. In plain terms, the market did not collapse. It became more selective.
County-Level Absorption Shows Where Softness Is Concentrating
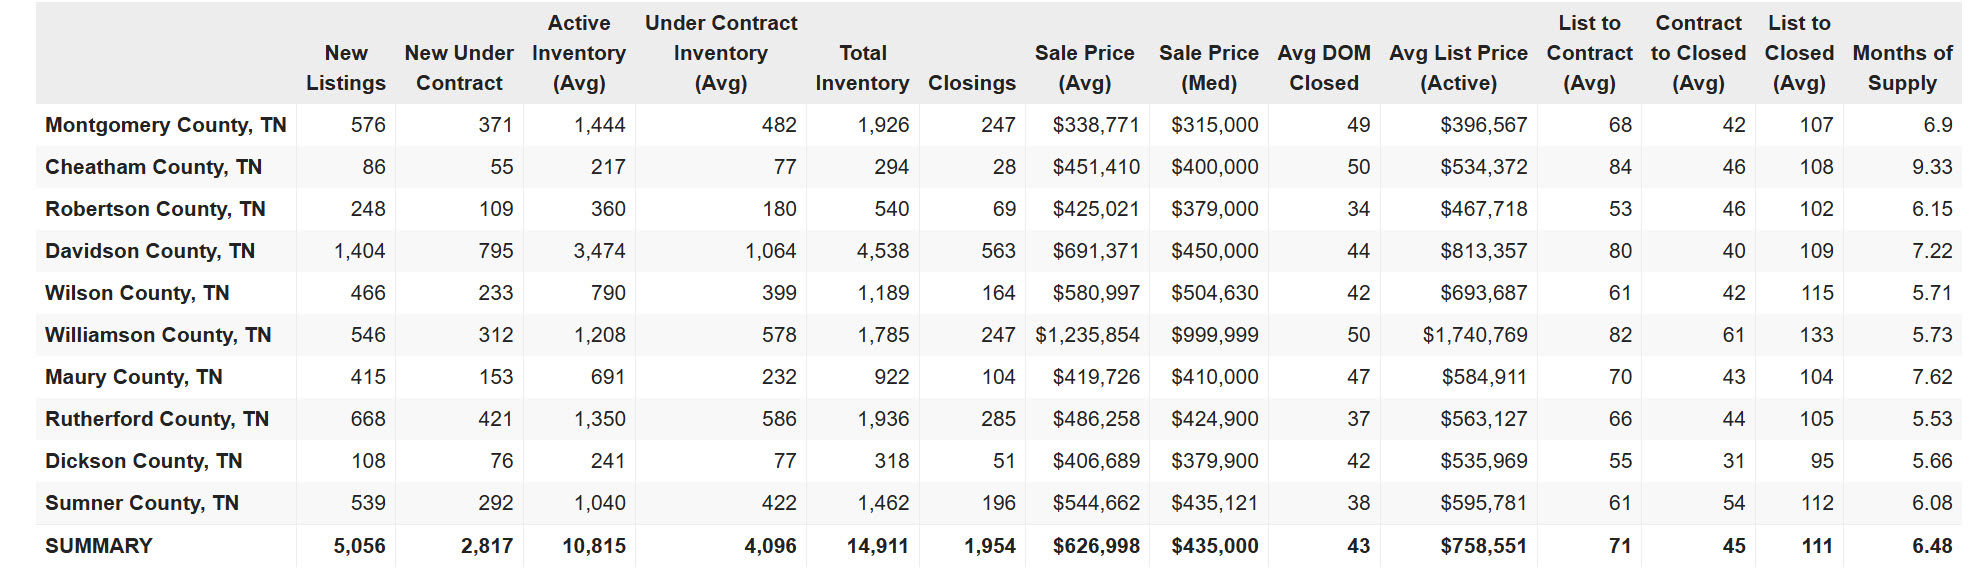
A useful near-term gauge is the ratio of new under contract listings to new listings. Higher ratios suggest tighter conditions, while lower ratios indicate softening.
Stronger absorption appeared in Dickson at roughly 70%, Montgomery around 64%, and Rutherford near 63%.
Middle-range conditions showed up in Cheatham, Williamson, and Davidson, all near the high-50s to low-60s depending on volume.
Softer conditions were evident in Robertson around 44% and Maury near 37%.
This does not mean prices will fall uniformly. It means negotiating dynamics and time on market are diverging by county and product type.
Macro Conditions Explain the Pattern
Three macro forces help explain why contracts held up even as the market softened.
Mortgage rates were lower than a year ago, with 30-year fixed rates around 6.1% in late January and early February 2026 compared with roughly 6.9% the prior year. That improvement supports contract activity.
The Federal Reserve held policy rates steady at its late-January meeting, keeping financial conditions restrictive but stable. The labor market cooled without breaking, with unemployment around 4.4% at the end of 2025. Inflation moderated as well, with year-over-year CPI near 2.7%.
Together, those factors reduce urgency without collapsing demand. Buyers remain active but more selective, which aligns with longer timelines, higher supply, and tougher negotiations.
What This Means Over the Next 60 to 120 Days
Buyer leverage is likely to persist unless mortgage rates fall materially or spring demand materially exceeds supply.
Pricing precision matters more than ever. Median softness combined with higher months of supply tends to punish aspirational pricing first. Well-located, turnkey, and correctly priced homes can still move. Everything else takes longer and concedes more.
Two indicators matter most to watch in real time:
- Weekly mortgage rate direction rather than absolute level
- New under contract activity relative to new listings
Those will tell you whether the market is stabilizing, re-accelerating, or continuing to tilt toward buyers.
Final Perspective
January data confirms that Middle Tennessee housing shifted toward buyers through slower absorption rather than a surge of new supply. Volume softened, timelines lengthened, and leverage became more localized.
For buyers, patience and selectivity are being rewarded. For sellers, precision and realism matter more than timing the broader cycle.
If you want to evaluate how this framework changes with February or March data, the same indicators will show whether conditions are stabilizing or continuing to tilt further toward buyers.