Middle Tennessee real estate market update for March 2026 shows rising inventory, stable home prices, and a market increasingly tilted toward buyers
The March 2026 Middle Tennessee real estate market shows a clear shift toward slower absorption, rising inventory, and continued price stability.
Transaction activity remains steady across the Nashville metro area. However, homes are taking longer to move from listing to closing. As a result, inventory is building even as buyer demand holds.
At the same time, mortgage rates in the mid-6% range continue to shape affordability. Buyers are still active, but they are more selective and more payment sensitive than in prior years.
The key trend in the March 2026 Middle Tennessee real estate market is rising inventory driven by slower transaction speed, not weakening demand.
This March 2026 Middle Tennessee real estate market update analyzes inventory trends, pricing behavior, months of supply, and county-level performance across the region.
Key Takeaways: Middle Tennessee Housing Market March 2026
- New listings declined 20% year over year
- Contracts increased 9%, signaling active demand
- Active inventory rose 11% across the region
- Closings declined 10% as timelines extended
- Months of supply increased to 4.97, up 21%
- Prices remained stable with slight divergence between average and median
Inventory is rising while closings decline, pushing months of supply higher across Middle Tennessee in March 2026
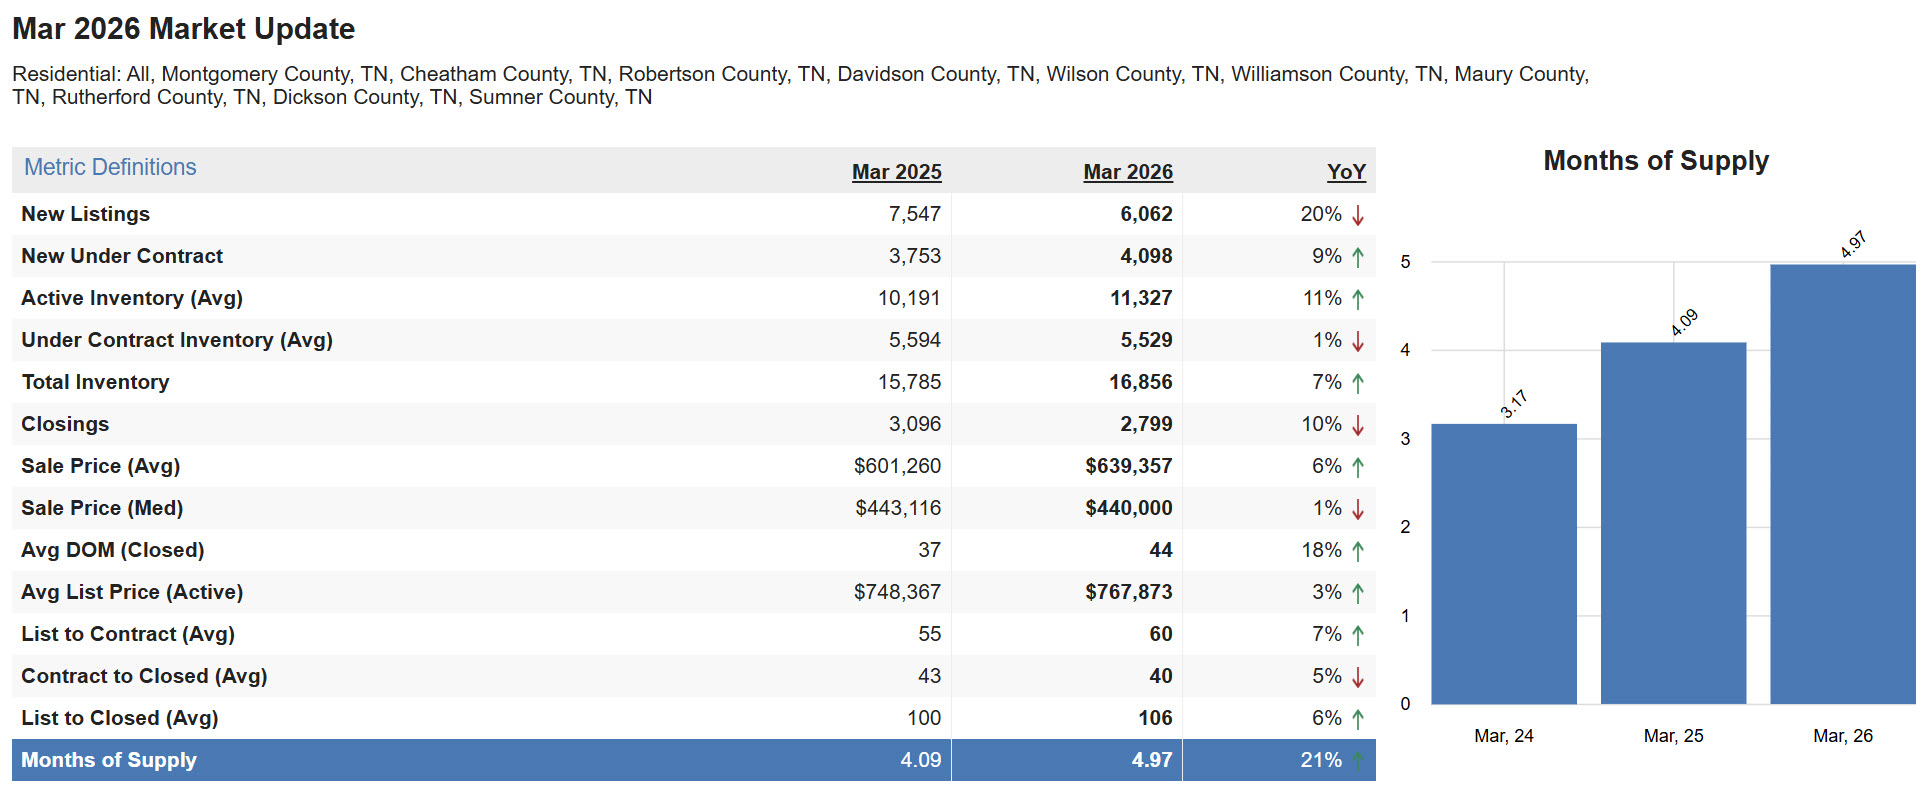
Middle Tennessee Real Estate Market Data March 2026
Across Montgomery, Cheatham, Robertson, Davidson, Wilson, Williamson, Maury, Rutherford, Dickson, and Sumner counties:
- New listings: 6,062, down 20%
- New under contract: 4,098, up 9%
- Active inventory: 11,327, up 11%
- Total inventory: 16,856, up 7%
- Closings: 2,799, down 10%
- Days on market: 44, up 18%
- Months of supply: 4.97, up 21%
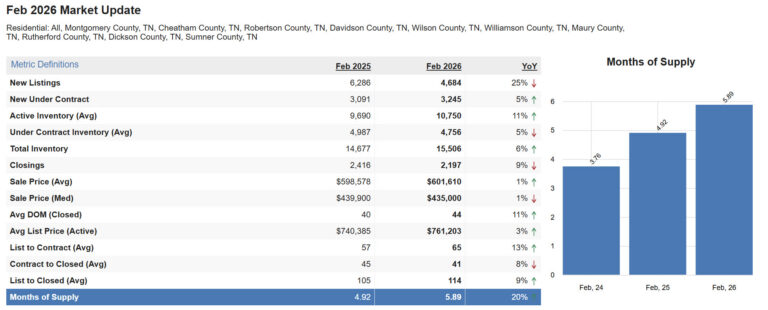
This continues a trend that began in our February 2026 Middle Tennessee real estate market update.
At that time, inventory was already rising while transaction timelines were extending. March data confirms that pattern has strengthened.
Inventory is increasing despite a sharp decline in new listings. At the same time, contracts are rising while closings are falling. As a result, demand remains present, but transactions are taking longer to complete.
In other words, the market is not slowing due to lack of demand. Instead, it is slowing due to friction in execution.
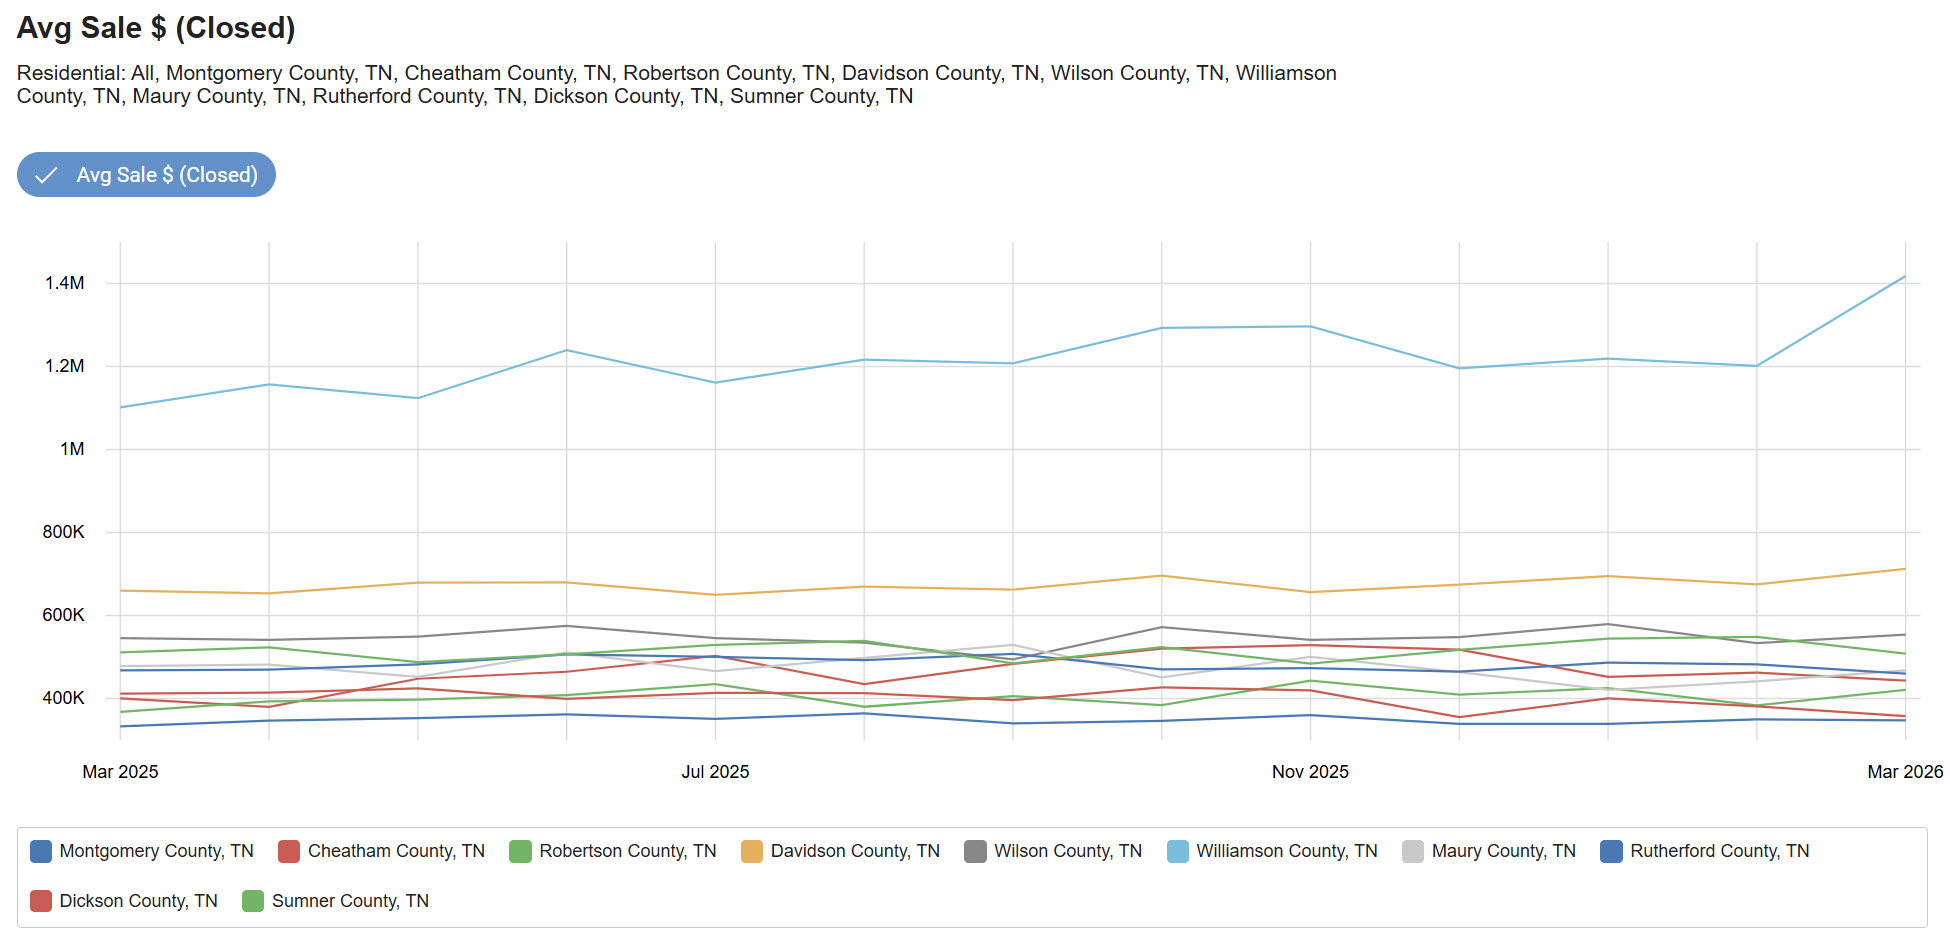
Closed Home Price Trends Over the Last 12 Months in Middle Tennessee
Closed home price trends across Middle Tennessee over the past 12 months continue to show stabilization rather than acceleration.
This is consistent with what we observed in February 2026, where pricing had already begun to move within tighter bands. March data confirms that pricing has not broken in either direction.
- Average sale price: $639,357, up 6% year over year
- Median sale price: $440,000, down 1% year over year
The divergence between average and median pricing remains a key signal. Higher-end transactions are supporting averages, while the broader market shows resistance at typical price points.
This is not a reversal. Instead, it is a continuation of a consolidation phase that began earlier in 2026.
As a result:
- Buyers have more negotiating leverage
- Sellers must price with precision
- Investors should underwrite for modest appreciation
Home prices across Middle Tennessee are stabilizing with selective strength at higher price points
County-Level Real Estate Trends in Middle Tennessee
County-level trends in March 2026 build on the divergence first observed in February. Differences in pricing, inventory, and absorption are becoming more defined across the region.
Davidson County Real Estate Market March 2026
- Average price: $712,018 (rising)
- Median price: $469,945 (stable)
- Months of supply: 5.8 (increasing)
Davidson County continues to move toward balanced conditions, a trend that began in February. However, days on market are increasing, reinforcing the need for precise pricing.
Williamson County Real Estate Market March 2026
- Average price: $1,418,246 (rising)
- Median price: $939,500 (stable)
- Months of supply: 4.89 (increasing)
Williamson County continues to show strength. However, buyer sensitivity at higher price points is becoming more evident compared to earlier in 2026.
Rutherford County Real Estate Market March 2026
- Average price: $459,302 (stable)
- Median price: $414,000 (stable)
- Months of supply: 4.01 (increasing)
Rutherford remains one of the tighter markets. Affordability continues to support demand, although inventory is beginning to build.
Robertson County Real Estate Market March 2026
- Average price: $420,717 (rising)
- Median price: $374,900 (stable)
- Months of supply: 4.09 (increasing)
Robertson County is stabilizing after higher supply levels earlier in 2026. However, inventory continues to build relative to demand.
Wilson County Real Estate Market March 2026
- Average price: $553,741 (rising)
- Median price: $506,145 (stable)
- Months of supply: 4.37 (increasing)
Wilson County remains near balanced conditions. Inventory growth is moderate, but absorption has slowed.
Maury County Real Estate Market March 2026
- Average price: $468,009 (stable)
- Median price: $435,695 (stable)
- Months of supply: 5.2 (increasing)
Maury County continues to show slower absorption, with increasing buyer leverage as inventory rises.
Montgomery County Real Estate Market March 2026
- Average price: $347,051 (stable)
- Median price: $330,000 (stable)
- Months of supply: 5.29 (increasing)
Montgomery County is trending toward balance. However, longer marketing times are becoming more common.
Sumner County Real Estate Market March 2026
- Average price: $509,236 (rising)
- Median price: $439,998 (stable)
- Months of supply: 4.78 (increasing)
Sumner County remains stable overall, although inventory is gradually building.
Dickson County Real Estate Market March 2026
- Average price: $357,468 (stable)
- Median price: $335,000 (stable)
- Months of supply: 4.29 (increasing)
Dickson County continues to operate within a balanced range, with slower transaction velocity.
Cheatham County Real Estate Market March 2026
- Average price: $442,847 (stable)
- Median price: $407,000 (stable)
- Months of supply: 5.35 (increasing)
Cheatham County continues to experience slower absorption, with inventory pressure building further in March.
Across the region, Middle Tennessee is no longer behaving as a single housing market. Instead, county-level dynamics are increasingly driving pricing, absorption, and negotiation trends.

County-level data highlights widening differences in pricing and absorption across Middle Tennessee
What Months of Supply Means in the Middle Tennessee Housing Market
Months of supply rose to 4.97 in March 2026, up 21% year over year.
Months of supply measures how long it would take to sell all active listings at the current pace of sales.
In February, months of supply had already moved higher. March confirms that this is part of a broader trend toward slower absorption.
Importantly, this increase is not being driven by new supply. Instead, it reflects longer transaction timelines.
In practical terms:
- Well-priced homes are still selling
- Overpriced homes are sitting
- Negotiation is increasing
This reflects normalization, not distress.
Middle Tennessee Real Estate Market Outlook for 2026
Inventory and Absorption Outlook in Middle Tennessee
The transition from February to March confirms that rising inventory is being driven by slower absorption, not an increase in new supply.
Unless mortgage rates decline meaningfully, months of supply will likely remain elevated. However, contract activity remains strong, suggesting absorption could improve quickly if financing conditions ease.
Home Price Outlook in Middle Tennessee
Price behavior continues to follow the stabilization pattern established earlier in 2026.
- Average sale price increased 6% year over year
- Median sale price declined 1%
This divergence reflects segmentation within the market. Higher-end transactions are supporting averages, while rate-sensitive buyers are limiting price growth at the median level.
As a result, price movement is becoming more selective.
Expect:
- Stability in well-positioned properties
- Pressure on overpriced listings
- Modest and uneven appreciation
County-Level Housing Market Trends to Watch in Middle Tennessee
The divergence observed in February is becoming more pronounced.
Middle Tennessee is fragmenting into micro-markets driven by affordability, financing conditions, and new construction competition.
The defining characteristic of the 2026 Middle Tennessee housing market is selectivity.
Middle Tennessee Real Estate Market FAQ
Is the Middle Tennessee housing market slowing down?
The market is not slowing due to lack of demand. Instead, transactions are taking longer due to higher mortgage rates, affordability pressure, and more selective buyer behavior.
Are home prices dropping in Middle Tennessee?
Not exactly. Prices are stabilizing rather than declining broadly. Average sale prices are still rising modestly, while median pricing shows mild resistance.
Is it a buyer’s market in Middle Tennessee?
The market is currently tilted in favor of buyers. Rising inventory, slower absorption, and longer transaction timelines are giving buyers more negotiating leverage across much of Middle Tennessee, although strong homes in desirable locations can still move quickly.