Newer report available: Read this week’s Nashville mortgage rate update (May 22, 2026) for the latest Freddie Mac PMMS data and analysis.
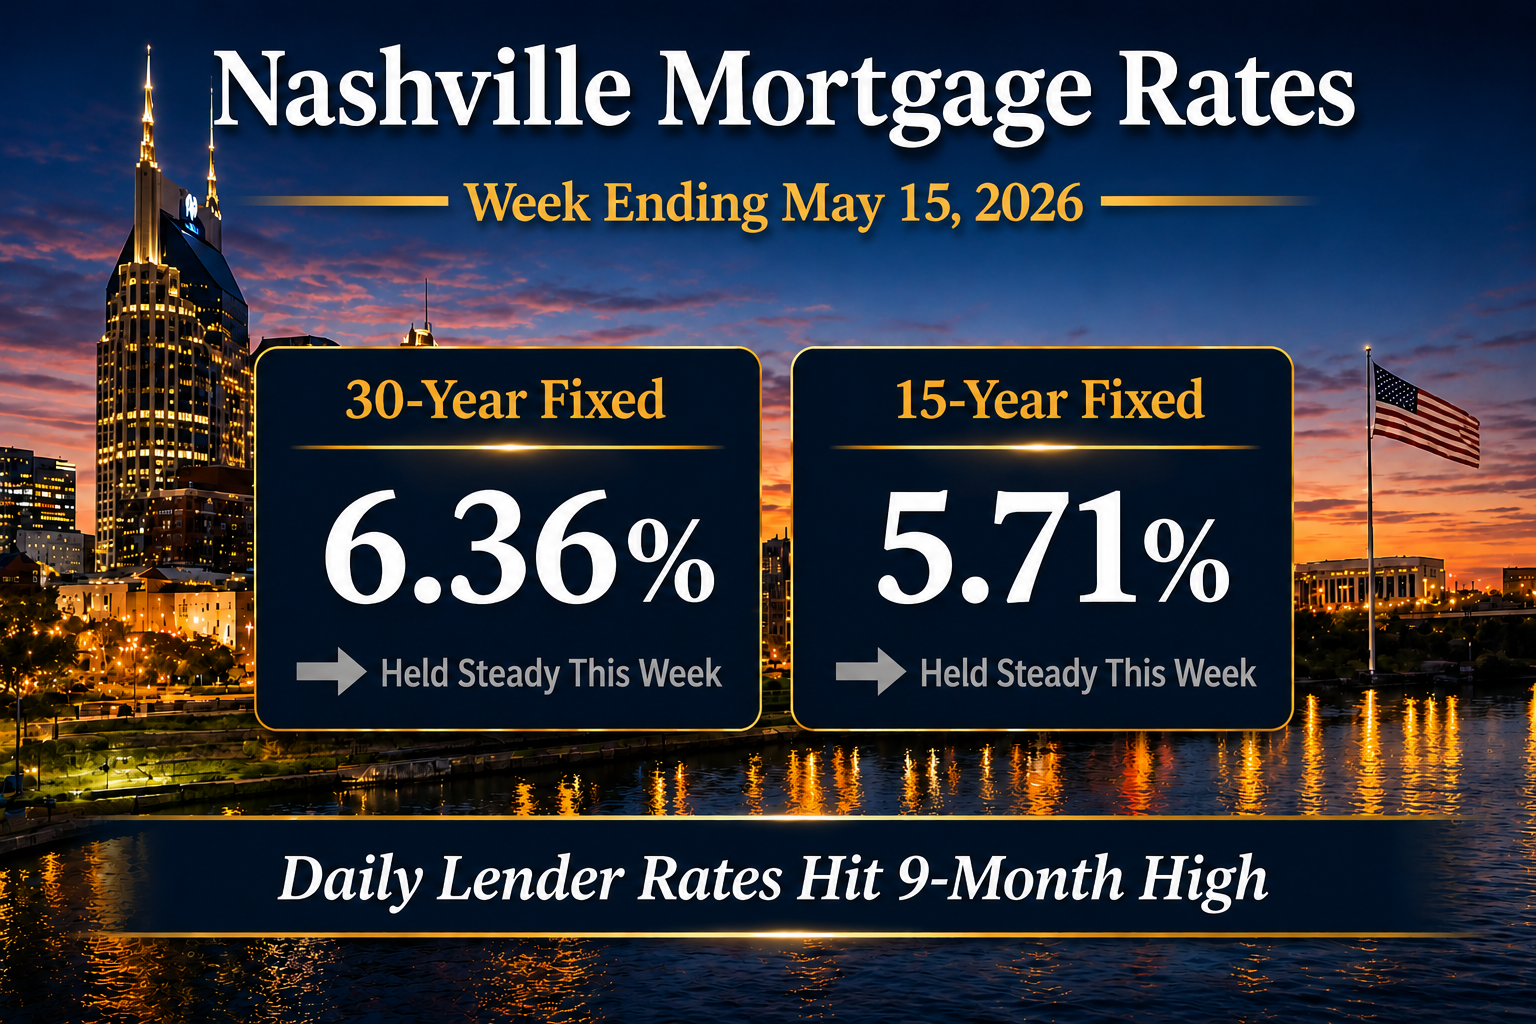
Nashville mortgage rates averaged 6.36% for the 30-year fixed and 5.71% for the 15-year fixed for the week ending May 14, 2026, according to Freddie Mac PMMS. However, that headline tells only half the story. By Friday afternoon, the average top-tier 30-year fixed rate at most lenders had climbed to roughly 6.62%. Notably, that is a nine-month high. Ask any parent of a small child: a lot can happen in nine months. The same is true for mortgage rates.
Here is the short version of what happened this week. First, the Trump and Xi summit in China wrapped up Friday with no progress on ending the Iran war. Bond traders had quietly priced in some hope for a diplomatic breakthrough. As a result, when the breakthrough did not arrive, that hope evaporated in a single trading day. Consequently, the 10-year Treasury yield jumped roughly 14 basis points on Friday alone to 4.60%. That is its highest level in a year. The bond market is the dog. Mortgage rates are the tail. When the dog moves like that, the tail follows.
For Nashville and Middle Tennessee buyers tracking current Nashville mortgage rate trends, the takeaway is simple. The rate quote you got on Monday probably looked meaningfully better than Friday’s quote. Specifically, the 30-year fixed has now retraced essentially the entire 0.65% rate decline of the past nine months. Most of that round trip happened over the past four weeks. Therefore, if you are under contract right now or planning to be soon, your timing on when to lock matters more this week than it has in months.
Market Summary
- Nashville 30-year fixed mortgage rate averaged 6.36% per Freddie Mac PMMS for the week ending May 15, 2026, while daily lender quotes climbed to approximately 6.62% by Friday’s close, the highest level since August 1, 2025
- Nashville 15-year fixed mortgage rate averaged 5.71% per Freddie Mac PMMS, down one basis point from the prior week and down from 5.92% one year ago
- FHA 30-year mortgage rates tracked near 6.10% based on MBA-tracked lender quotes for conforming loans
- The 10-year Treasury yield ended Friday at approximately 4.60%, the highest level in a year, after climbing roughly 14 basis points on the failed Trump and Xi summit
- Producer Price Index annual rate surged to 6.0% in April, the highest reading since December 2022, with Core PPI hitting 5.2% annually
- Federal Reserve policy remained restrictive under newly confirmed Chair Kevin Warsh; futures markets have priced out any 2026 rate cut and now reflect a roughly 39% probability of a 2026 rate hike
- MBA mortgage applications rose 1.7% for the week ending May 8, with purchase applications up 4% and refinance share falling to 40.8%, the lowest since August 2025
- Mortgage spreads narrowed to roughly 1.76% or 176 basis points, with continued Fannie Mae and Freddie Mac mortgage-backed securities buying preventing rates from re-crossing 7%
The week’s data came from the Freddie Mac PMMS release on Thursday, May 15, 2026, with daily rate context from Mortgage News Daily, macro data from the Bureau of Labor Statistics April CPI release on May 12 and April PPI release on May 14, and application data from the Mortgage Bankers Association Weekly Applications Survey released May 13.
Mortgage Rate Dashboard
The mortgage rate dashboard shows a 6.36% 30-year fixed rate, a 5.71% 15-year fixed rate, an FHA 30-year rate near ~6.10%, a 10-year Treasury yield near ~4.60%, and a mortgage spread near ~1.76%.
Nashville Mortgage Rates This Week
The PMMS Headline vs. the Friday Reality
The week told two stories. The Freddie Mac PMMS headline showed rates dipping one basis point to 6.36%. Importantly, that number captures Monday through Wednesday loan applications. Freddie publishes this data every Thursday at noon. However, by the time you read the press release, the bond market had already moved past it. The number that better reflects a Nashville buyer’s actual Friday quote was about 6.62%. Notably, we last saw that level in early August of last year.
So how did rates climb 0.23% in a week when the headline went down? The answer is timing. Daily lender quotes move with the bond market in near-real time. In contrast, the Freddie Mac survey is a weekly snapshot. As a result, when the bond market sells off late in a week, the Freddie number from earlier in that week looks stale by Friday. This week the gap between the two was unusually wide. Both numbers are true. They just measure different things at different moments.
What Triggered the Friday Sell-Off
The bond market sold off this week for three reasons. First, Tuesday’s Consumer Price Index report came in hotter than expected. Specifically, Core inflation accelerated to 2.8% annually. Then on Wednesday, the Producer Price Index surged to 6.0% annually. Notably, that is the highest reading since December 2022. PPI measures wholesale prices upstream from consumer prices. Wholesale price increases usually pass through to consumer prices within a few months. Therefore, the inflation pressure already showing in PPI is likely to keep showing in CPI through the summer.
The third hit came Friday. President Trump and President Xi finished their China summit with no movement on ending the Iran war. Previously, some traders held small bets that a diplomatic catalyst might emerge from those conversations. However, when the catalyst did not appear, those bets unwound in a single afternoon. Consequently, the 10-year Treasury yield climbed roughly 14 basis points on Friday alone to 4.60%. That is its highest level in a year. Mortgage rates followed directly.
Institutional Macro Snapshot
What Is Driving Mortgage Rates Right Now
If you want to understand why mortgage rates are where they are this week, the cleanest way is a four-step chain. It traces straight back to the Iran war.
1. The Iran War and the Inflation Chain
First, mortgage rates are based on bonds, specifically the 10-year Treasury yield. Second, bond investors hate inflation. Inflation eats away at the fixed payments they receive over the life of a bond. Third, war pushes fuel prices higher, which feeds inflation throughout the economy. Finally, higher inflation forces bond yields higher, which forces mortgage rates higher. Therefore, almost all of the 0.65% rate climb of the past nine months traces directly to the war.
Additionally, there is a parallel channel that gets less attention. Wars cost money. The federal government funds those costs partly through issuing new Treasury debt. As a result, more debt issuance means more bonds being sold into the market. Consequently, that pushes long-end yields up. This is happening at the same time as the inflation channel. The two reinforce each other.
2. CPI and PPI Confirmed Both Channels Are Operating
This week’s data confirmed both channels are operating at full strength. April’s Consumer Price Index hit 3.8% annually. Notably, that is the highest since May 2023. Core CPI accelerated to 2.8%, the highest since September. Meanwhile, wholesale prices ran even hotter. The Producer Price Index hit 6.0% annually. Specifically, we have not seen that level since December 2022. Core PPI at 5.2% suggests the inflation pulse is broadening well beyond just energy. Furthermore, wholesale prices typically pass through to consumer prices with a two-to-three month lag. In effect, the inflation pressure visible today has more momentum to deliver before it peaks.
3. GSE Mortgage-Backed Securities Buying Is the Countervailing Force
The fourth force works in the opposite direction. Fannie Mae and Freddie Mac have ramped up their mortgage-backed securities purchases. As a result, they have narrowed the spread between mortgage rates and Treasury yields. Without that intervention, daily lender rates that finished Friday near 6.62% would likely be closer to 7%. In effect, the GSEs are subsidizing rates by 30 to 50 basis points relative to where the math would otherwise put them.
Reading last week’s Nashville mortgage rate update alongside this one shows the speed of the shift. Last Friday the 30-year fixed was hovering near 6.39%. The macro picture was described as tense but range-bound. However, by this Friday daily lender rates had climbed to roughly 6.62%. The macro picture had decisively turned. That is not a normal week of mortgage rate movement. Specifically, this is what happens when bond markets get a bad inflation report and a failed peace summit in the same five-day window.
The 10-Year Treasury and Mortgage Rate Spreads
This Week’s Treasury Move
The 10-year Treasury yield is the single most important number for any Nashville buyer who plans to finance. Mortgage rates do not exactly match Treasury yields. However, they track them closely. Specifically, any movement in the 10-year passes through to mortgage rates within a few trading sessions. Therefore, knowing where Treasury yields are heading is the closest thing to a leading indicator that exists for mortgage rates.
This week the 10-year Treasury yield finished Tuesday at 4.46%. By Friday’s close, it had risen to approximately 4.60%. Notably, Friday alone accounted for roughly 14 basis points of that move. The move followed the failed Trump and Xi summit and confirmation of accelerating wholesale inflation. Importantly, the 4.60% level is the highest 10-year yield in a year. As a result, it reverses roughly half of the Treasury rally that supported lower mortgage rates from mid-2025 through early 2026.
Calculating the Current Spread
The mortgage spread at the time of the Freddie Mac PMMS release was approximately 1.76%. The calculation is straightforward: 6.36% Freddie Mac 30-year fixed minus 4.60% 10-year Treasury yield. That spread is 176 basis points. Two factors are driving the narrower spread compared to recent years. First, Fannie Mae and Freddie Mac have increased MBS buying. Second, the mortgage-backed securities market has lower volatility than during the 2023 regional banking crisis.
What the Tighter Spread Means for Nashville Buyers
The historical mortgage spread averages around 170 basis points. Therefore, a 176 basis point spread is essentially right at the historical norm. The implication for Nashville buyers is meaningful. Specifically, the cushion that used to absorb Treasury yield increases is gone. As a result, if the 10-year Treasury keeps climbing toward 4.75%, the 30-year fixed could push toward 6.50% to 6.65% at PMMS levels. Daily lender levels could reach 6.75% to 6.90%. Conversely, if a peace deal in Iran materializes and the 10-year Treasury falls back to 4.20%, the 30-year fixed could approach 6.00%.
The GSE intervention deserves its own paragraph because it is genuinely doing the heavy lifting. Without active MBS buying by Fannie Mae and Freddie Mac, the daily lender environment near 6.62% would have crossed 7%. Notably, we saw exactly that dynamic in the first half of 2025. Treasury yields were sitting at similar levels and mortgage rates were 7% instead of 6.62%. Therefore, the current spread is doing real work for Nashville buyers. However, it is not unlimited capacity.
Payment Impact for Nashville Buyers
The disconnect between the Freddie Mac headline rate and Friday’s daily lender quotes translates into real dollars for any Nashville buyer financing a purchase this week. The calculations below show monthly principal and interest at both rate points using the standard amortization formula, for the loan amounts most common in the Nashville and Middle Tennessee market.
| Loan Amount | 30-Year @ 6.36% (PMMS) | 30-Year @ 6.62% (Friday lender) | Difference per Month | 15-Year @ 5.71% |
|---|---|---|---|---|
| $400,000 | $2,491 | $2,560 | +$69 | $3,313 |
| $500,000 | $3,114 | $3,200 | +$86 | $4,141 |
| $750,000 | $4,671 | $4,801 | +$130 | $6,212 |
| $1,000,000 | $6,228 | $6,402 | +$174 | $8,283 |
The 26 basis point gap between the Freddie Mac PMMS average and Friday’s daily lender rate translates to between $69 and $174 in additional monthly payment depending on loan size. Spread over a 30-year amortization, that is $25,000 to $63,000 in additional total interest paid over the life of the loan. A buyer who locked Monday at 6.30% versus a buyer who has to lock Friday at 6.62% is looking at meaningfully different financial outcomes for the same property.
A Nashville buyer at the metro median price point of roughly $440,000 with 20% down has a $352,000 loan and a principal-and-interest payment of approximately $2,193 at the Freddie PMMS rate. That same loan at Friday’s daily lender rate of 6.62% costs $2,254 per month, a $61 increase. Real estate taxes, homeowners insurance, and any HOA dues are additional to these figures. For Nashville buyers shopping in The Gulch high-rise market or Brentwood luxury communities where loan sizes run higher, the dollar impact scales proportionally.
Strategic Borrower Considerations This Week
The combination of a 9-month high in daily lender rates, accelerating inflation, and no near-term diplomatic catalyst changes the calculus for every kind of Nashville buyer. Here is how I would think about each profile.
Buyers Under Contract or Planning to Lock Within 30 Days
The case for locking has strengthened materially this week. Friday’s 14 basis point Treasury yield jump on a single trading day shows how quickly the rate environment can deteriorate. As a result, the downside risk of waiting now substantially exceeds the upside potential. Specifically, rates climbing toward 6.85% to 7.00% is a real risk if the war drags on. In contrast, the upside scenario requires rates falling back to 6.10% to 6.25%. Therefore, if you have lock-or-float flexibility from your lender, I would be biased toward locking.
Buyers Shopping in the $1M+ Luxury Segment
Jumbo rates continue to track close to conforming this week. Specifically, the MBA-tracked jumbo 30-year is at 6.48% versus the conforming 30-year at 6.46%. Notably, the historical jumbo premium has compressed to roughly two basis points. As a result, this favors buyers who would have previously preferred a conforming-eligible price point. Furthermore, Nashville’s $1M+ market continues to be supported by inbound corporate relocation, cash-rich buyer demand, and unique-architecture properties. These properties move on factors other than mortgage rate sensitivity.
STR and Investment Property Buyers
Investor loan pricing typically runs 75 to 125 basis points above owner-occupied rates. Therefore, Nashville Airbnb buyers are near 7.50% to 7.75% on conventional 30-year terms at Friday’s daily lender rates. DSCR loan pricing is comparable or modestly higher. The math for a Nashville Airbnb purchase still works in well-located buildings with strong revenue history. However, the margin of safety on cap rate underwriting has narrowed. Additionally, BL2019-1633 has limited new non-owner-occupied short-term rental permits in residential zones since January 2022. Consequently, properties with existing grandfathered NOOSTR permits continue to command a premium that partially offsets the higher financing cost.
Sellers in 2026
The Zillow April Market Report tells a story sellers need to hear. New listings rose 2.1% year over year while sales fell 0.4% year over year. Notably, April was the first month in 2026 where listing growth outpaced sales growth. As a result, competition among sellers is building. Therefore, pricing realistically is now more important than it was three months ago. The Redfin data confirms this trend. Specifically, only 26.4% of homes sold above list price in the four weeks ending May 3. That is the lowest share for this time of year in at least five years. Move-in ready homes priced fairly are still receiving multiple offers. In contrast, outdated or aspirationally-priced homes are sitting. Furthermore, Compass Concierge can help fund pre-listing improvements that compress days on market.
Refinance Candidates
The refi window has effectively closed for most owners who purchased between 2022 and early 2024. Specifically, the 30-year fixed sits roughly 100 to 150 basis points above current portfolio rates for that vintage. The MBA refinance share falling to 40.8% this week confirms what borrowers are seeing in their own circumstances. Notably, that is the lowest level since August 2025. Therefore, refi makes sense almost exclusively for owners who locked in late 2024 or early 2025 at peak rates and can capture 50 or more basis points of relief today. Alternatively, refi may work for owners with cash-out refinance needs where the rate is secondary to the equity access.
Nashville Real Estate Market Outlook
Pending Sales Signal Demand Sensitivity to Rate Changes
The most encouraging data point this week came from buyer behavior rather than rate markets. Specifically, national pending home sales hit their highest level since September 2022 during the four weeks ending May 3. Notably, 340,101 contracts were signed, a 7.7% year-over-year increase on a seasonally adjusted basis. Importantly, that data captures the brief window when daily mortgage rates dipped to 6.23%. As a result, within two weeks of rates falling, buyers came off the sidelines in numbers we have not seen in nearly four years.
Five metros led the surge. Specifically, Chicago jumped 19.2%, Pittsburgh 16.5%, San Francisco 15.2%, Miami 15.0%, and Austin 14.6%. Notably, these are not boomtowns. They are markets where the math suddenly worked again at 6.23%. Furthermore, Nashville’s underlying demand profile is supported by corporate relocation, healthcare and music industry employment, and a continuing inbound migration story from higher-tax states. Therefore, our local response to brief rate dips will likely look similar.
The implication is meaningful. Specifically, the market is sensitive to small rate movements at the margin. The brief two-week window when rates touched 6.23% pulled forward enough demand nationally to create the strongest pending sales period in nearly four years. As a result, if the Iran war’s eventual resolution returns rates to that range, Nashville’s transaction velocity will likely accelerate quickly. Conversely, if the war drags on and rates settle in the 6.50% to 6.65% range, transaction volume will normalize at lower levels. However, the market will continue to function.
Zillow Inventory Data Adds a Counterweight
The Zillow April Market Report adds an important counterweight to the pending sales optimism. Specifically, new listings rose 2.1% year over year in April to 426,000-plus. Meanwhile, home sales fell 0.4% year over year. Notably, April was the first month in 2026 where new listings outpaced sales growth on an annual basis. Active inventory reached 1.3 million nationally, up 3.7% from April 2025. As a result, the combination of more supply hitting the market while demand is rate-sensitive means leverage in negotiations has shifted somewhat toward buyers. This is particularly true for properties that need updating or are priced aspirationally.
For Nashville, this means we are in a market where buyers have more options than they did a year ago. However, they are also more selective. Move-in ready properties at fair prices are still attracting bidding wars. In contrast, older homes needing repair, or homes priced above what comparable recent sales support, are sitting longer. Notably, the Chicago Redfin agent quoted in the May 7 Redfin report captured it well: “A new kitchen and new bathroom are the ticket to a bidding war. Older homes that need repairs, and those far above the most popular price range, are taking longer to sell.” Specifically, that dynamic is operating in Nashville too. Furthermore, it is particularly visible in the $400K to $800K range that represents most local transactions.
The Strategic Question for Nashville Buyers
For Nashville buyers tracking Mortgage Rates and Financing coverage over time, the strategic question has shifted. The question is no longer “when will rates fall?” Instead, it is “how do I structure a purchase that makes sense at current rates?” Specifically, we know brief rate dips will create competitive windows. Therefore, waiting for a perfect rate environment that may not materialize until 2027 carries its own opportunity cost. Notably, the right property at the right price still moves quickly in this market.
For broader context, the May 1 Nashville mortgage rate update documented the early signs of inflation acceleration. As a result, those signs have now fully expressed in this week’s CPI and PPI data. The trend remains intact. Importantly, the path back to mid-2025 rate levels requires a specific catalyst that the market has not yet seen.
Nashville Mortgage Rates FAQ
What are Nashville mortgage rates today?
Nashville mortgage rates averaged 6.36% for the 30-year fixed and 5.71% for the 15-year fixed for the week ending May 15, 2026, according to Freddie Mac PMMS. Daily lender quotes climbed to approximately 6.62% by Friday’s close, the highest level since August 1, 2025. The gap reflects the Freddie Mac survey window closing before Friday’s bond market sell-off triggered by the failed Trump and Xi summit.
Why did Nashville mortgage rates jump to a 9-month high this week?
Nashville mortgage rates jumped to a 9-month high because the Trump and Xi summit ended without progress on an Iran peace deal, eliminating a diplomatic premium that bond traders had built in. The 10-year Treasury yield climbed roughly 14 basis points on Friday alone to 4.60%, daily lender rates rose approximately 0.23% across the week to 6.62%, and Producer Price Index data showed wholesale inflation accelerating to 6.0% annually, the highest since December 2022.
What is the mortgage spread and why does it matter for Nashville buyers?
The mortgage spread is the difference between the 30-year fixed mortgage rate and the 10-year Treasury yield, currently approximately 176 basis points calculated as 6.36% minus 4.60%. The historical average is around 170 basis points and the 2023 peak reached 300 basis points. Fannie Mae and Freddie Mac have ramped up mortgage-backed securities purchases, which is the primary reason mortgage rates have not re-crossed 7% even as Treasury yields climbed back to year-ago levels.
Should I lock my Nashville mortgage rate this week?
The case for locking a Nashville mortgage rate this week is strong given Friday’s 9-month high in daily lender rates and the failed Trump and Xi summit eliminating near-term peace catalysts. The downside risk of waiting (rates climbing toward 6.85% to 7.00% if the war drags on) substantially exceeds the upside potential (rates falling back to 6.10% to 6.25%). Buyers under contract or planning to close within 30 days are generally best served by locking now rather than floating into ongoing geopolitical uncertainty.
How is the Iran war affecting Nashville mortgage rates?
The Iran war has driven essentially all of the 0.65% Nashville mortgage rate climb of the past nine months through two channels. Higher fuel and energy prices push inflation higher, which forces bond yields higher and mortgage rates with them. The war also requires increased federal government debt issuance, which pushes long-end Treasury yields up. Daily lender rates now sit at approximately 6.62%, the highest since August 1, 2025, with rates highly sensitive to every diplomatic and military development.
Sources and methodology
Rate data in this update reflects weekly averages from the Freddie Mac Primary Mortgage Market Survey (PMMS) for the week ending May 15, 2026. Daily lender pricing context is sourced from the Mortgage News Daily Mortgage Rate Index. Macro indicators including the 10-year Treasury yield reference Federal Reserve Economic Data (FRED) series DGS10. Spread analysis between mortgage rates and the 10-year Treasury uses the historical PMMS minus DGS10 series. Nashville-area builder buydown and concession observations reference active Middle Tennessee MLS data via the RealTracs system and conversations with local lenders. Year-over-year comparisons reference the same Freddie Mac PMMS week from the prior year.
- Freddie Mac Primary Mortgage Market Survey (PMMS): weekly 30-year and 15-year fixed rate benchmarks
- FRED DGS10: 10-year Treasury Constant Maturity Rate
- Mortgage News Daily Rate Index: daily lender pricing observations
- Federal Reserve FOMC Calendar: meeting dates and policy context
Important mortgage rate disclaimer
Rates and figures on this page are educational and reflect the data sources cited. They are not an offer, commitment to lend, or rate lock. Mortgage rates change daily and depend on individual credit profile, loan-to-value, property type, occupancy, and lender. For a pre-qualification and personalized rate quote, contact a licensed mortgage lender (NMLS-registered). Past rate movements do not predict future rates.