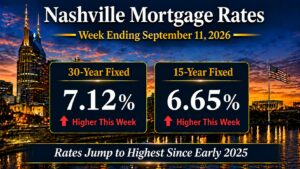
Nashville Mortgage Rates: Week Ending September 11, 2026 Recap and the Week Ahead
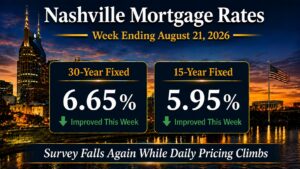
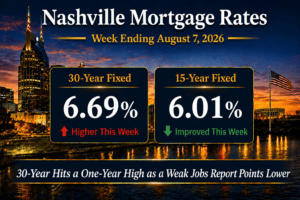
Nashville mortgage rates jumped 23 basis points to 7.12% on the 30-year and 6.65% on the 15-year, the highest daily index reading...
Updated September 6, 2026 · 53 posts in this archive · 2006 to 2026 · 10-year Treasury yield analysis from Grant Hammond
Quick answer: Mortgage rates follow the 10-year Treasury, not the Fed’s policy rate. This archive tracks that yield week by week, with the 30-year fixed beside it and the gap between them, because that gap is where most of the movement in a Nashville buyer’s payment comes from.
10-year Treasury yield analysis from Grant Hammond, in date order. Each entry reports the yield and the mortgage rate for the same week, captured the same way. Figures pulled from different days produce a trend that never happened. For the current rate picture, see Nashville mortgage rates today, or the weekly Nashville mortgage rate archive.
The yield for the week, the 30-year fixed beside it, and the spread between them. Each entry says what moved the yield: an inflation print, a Treasury auction, or a shift in what the market expects from Federal Reserve policy. Then it works the number through to a payment at Middle Tennessee price points.
Because lenders price a 30-year mortgage against a long-dated government benchmark, and the 10-year is the closest match to how long that mortgage actually stays outstanding. The Fed moves the yield through expectations rather than setting it. That is why a Fed meeting can pass with no change to the policy rate while mortgage rates move anyway, and why the reverse happens just as often. The spread between the yield and the 30-year fixed has a life of its own as well, driven by lender risk appetite and demand for mortgage-backed securities. Watch one number and you will misread the week. Watch both and it usually makes sense.
A national benchmark, read for its local consequence. Davidson County and Williamson County, from under $500K through $2.5M and above, for buyers deciding whether to lock or float.
Grant Hammond is a Nashville real estate broker at Compass RE. He has 25 years of experience and over $1 billion in career sales across Davidson and Williamson Counties. Furthermore, his market analysis appears regularly in major publications, including the Wall Street Journal, the Los Angeles Times, The Tennessean, and the Nashville Business Journal. Tennessee Real Estate Broker License #261980.