This weekly Nashville mortgage rates report tracks borrowing conditions for buyers and homeowners across Nashville, Franklin, Brentwood, and the broader Middle Tennessee housing market.
For long-term trends and historical comparisons, visit Nashville mortgage rates today.
Market Summary
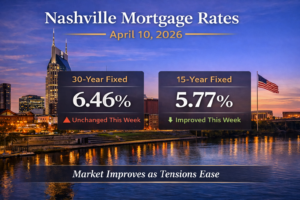
- Nashville 30-year fixed mortgage rate averaged 6.46% during April 6 to April 10, 2026.
- Nashville 15-year fixed mortgage rate averaged 5.77% across Middle Tennessee.
- FHA 30-year mortgage rates held near the ~6.00% range.
- The 10-year Treasury yield closed at 4.31%.
- Mortgage spreads remained near 2.15% (215 bps).
- Federal Reserve policy remained restrictive.
Mortgage Rate Dashboard
Nashville Mortgage Rates This Week
Nashville mortgage rates for the week ending April 10, 2026 averaged 6.46% for 30-year loans and 5.77% for 15-year loans. Mortgage pricing across Middle Tennessee continues to follow movements in the bond market, especially the 10-year Treasury.
However, weekly averages lag real-time conditions. During the week, daily pricing improved and reached the best levels in roughly three weeks. This confirms that the market has moved away from the sharp volatility seen in March.
What Is Driving Mortgage Rates Right Now?
Mortgage rates are being driven by geopolitical developments, energy prices, and inflation data.
First, easing tensions in the Iran conflict helped stabilize global markets. As a result, oil prices dropped sharply from recent highs. Lower energy costs reduce inflation pressure, which supports bond prices and helps bring rates down.
Next, the bond market responded quickly. The 10-year Treasury yield, which peaked near 4.48% in late March, has improved and is now holding near the 4.30% range. Mortgage rates followed that move, with daily pricing trending lower during the week.
At the same time, inflation remains a constraint. Recent data came in hotter than expected, reinforcing a cautious stance from the Federal Reserve. This limits how quickly rates can decline.
As a result, the market is now range-bound rather than directional.
Institutional Macro Snapshot
10-Year Treasury and Mortgage Rate Spreads
The 10-year Treasury closed at 4.31%, but the broader context is critical.
Rates are currently trading within a defined range:
- 4.20% → support
- 4.50% → resistance
Mortgage rates are moving within that same structure.
- Mortgage rate: 6.46%
- Treasury: 4.31%
- Spread: 215 bps
Spreads remain elevated compared to historical norms. However, they stabilized this week, which is an early sign of improving mortgage market conditions.
The chart below shows how closely mortgage rates track the 10-year Treasury, while the dashed line represents the spread between the two over time.
Borrower Strategy in Today’s Mortgage Rate Environment
Rate Volatility Is Shifting to Stability
Mortgage markets have transitioned from rapid swings to a more stable pattern. Daily movements are smaller, and lenders are adjusting pricing less frequently. This allows borrowers to make decisions with more confidence.
Buydown Economics
In today’s market, rate buydowns often provide more value than price reductions. Lowering the interest rate directly reduces the monthly payment, which improves affordability immediately.
Refinance Threshold
Refinancing still requires a meaningful rate improvement. Most borrowers need a 0.75% to 1.00% drop to justify costs. However, borrowers who locked above 6.75% may benefit if rates continue to improve.
MBS Market and Spread Dynamics
Mortgage spreads remain above 200 basis points, keeping rates elevated. However, spreads stabilized this week and aligned more closely with Treasury movement. If spreads compress, rates could fall without a major shift in Treasury yields.
FHA and VA Loan Insights
FHA mortgage rates remain near the ~6.00% range, offering a relative affordability advantage. These programs continue to support first-time buyers.
VA loans remain highly competitive due to zero down payment options. VA participation continues to hold within the ~17% to 19% range.
Payment Impact Example
For a $400,000 loan with a 30-year fixed mortgage:
- At 6.46%, the monthly principal and interest payment is approximately $2,520
- At 6.38%, the payment was approximately $2,500
👉 Weekly difference: +$20 per month
While this change is modest, it highlights how even small rate movements impact affordability.
What This Means for Nashville and Middle Tennessee
Mortgage rates remain elevated, but the more important shift is stability after volatility.
The Nashville housing market is not weakening structurally. Instead, it is adjusting to higher borrowing costs and more selective demand. Inventory remains limited in key submarkets, and demand continues to hold.
Looking ahead, the most likely outcome is continued movement within the current range. If the 10-year Treasury remains between 4.20% and 4.50%, mortgage rates will likely stay in the mid-6% range.
However, if geopolitical tensions continue to ease and oil prices remain lower, rates could move toward the low 6% range. If that happens, buyer demand in Nashville could accelerate quickly as sidelined buyers return.
What to Watch for Mortgage Rates Next Week
- Producer Price Index (PPI)
A key measure of pipeline inflation. - 10-year Treasury movement
Markets will watch whether yields hold near support. - Energy prices
Oil price stability remains critical. - Federal Reserve positioning
Markets are preparing for the late-April meeting.
The key question is whether stabilization continues or volatility returns.
Buyers and homeowners often ask how these rate movements impact real decisions. Here are the most common questions this week.
Nashville Mortgage Rates FAQ
What are mortgage rates in Nashville right now?
As of the week ending April 10, 2026, the average 30-year fixed mortgage rate is 6.46%, while the 15-year fixed rate is 5.77%, according to Freddie Mac.
Why are mortgage rates still elevated in 2026?
Mortgage rates remain elevated due to persistent inflation, elevated Treasury yields, and a restrictive Federal Reserve policy stance. While recent geopolitical easing has helped rates stabilize, inflation continues to limit how quickly borrowing costs can decline.
Are mortgage rates improving right now?
Mortgage rates improved during the week on a daily basis, reaching the best levels in roughly three weeks. However, weekly averages remain elevated due to the lag in Freddie Mac’s survey methodology.