Brentwood closed 461 homes over the last six months at a median price of $1,320,000, the highest median of any submarket I track in Middle Tennessee. But the median hides the real story. The same six months produced a $373,000 closing in an established 1980s subdivision and a $4.32 million median in a new-construction enclave delivered in 2024. Brentwood is not one market; it is two markets sharing one ZIP code, separated almost entirely by build era.
Brentwood single-family: a balanced market as of 08-21-2026. About 4.1 months of supply, 97.8% sale-to-list.
Balanced market
Full Brentwood market detail
| Active listings | 337 |
|---|---|
| Median list price | $1,999,900 |
| Median $/sqft (list) | $414 |
| Median days on market | 43 days |
| Homes closed (24-mo) | 1,673 |
| Median closed price | $1,375,000 |
| Average closed price | $1,737,477 |
| Median closed $/sqft | $347 |
| Top recent closed sale | $9,327,883 (9634 Concord Rd, 11,118 sq ft, $839/sq ft) |
| Sale-to-list | 97.7% |
| Months of supply | 4.1 |
| Top active listing | $16,000,000 (9238 Nina Ct, 11,352 sq ft) |
| ZIP | 37027 |
As of (337 active listings). Source: RealTracs via IDX. Analysis by Grant Hammond.
What's your Brentwood home worth? Get a free local valuation →
If you are tracking Brentwood TN home prices, start with my Brentwood homes overview for live inventory. This post is the closed-data companion to that page, and a read worth putting next to my Nashville housing market analysis across the rest of the metro.
What do Brentwood TN home prices look like right now?
Across the trailing six months, 461 homes settled in Brentwood at a median closed price of $1,320,000 and a median of $346 per square foot, on a median home size of about 3,809 finished square feet and a median sale-to-list ratio of 98.3%. The middle half of those sales ran from about $810,000 to $2.1 million, the widest interquartile band of any submarket I cover. The distribution shows why: Brentwood carries meaningful weight at both the entry and the top.
Why does Brentwood split into two price markets?
The split is build era, and the subdivision data makes it unmistakable. Established subdivisions let a buyer into the Brentwood ZIP under $1 million; new-construction enclaves command roughly double the price per square foot and run well into the millions. That gap, not location, is what splits the market in two.
When I advise a buyer here, the first question is not neighborhood, it is whether they are buying new construction or established, because that single choice decides which half of the market their budget competes in.
What is the Brentwood top end doing?
The top end is its own market with its own buyer pool, and right now it is slow. The live single-family snapshot above reads as a buyer’s market at about 11.6 months of supply, and that weight sits disproportionately above $2 million. The highest closings this cycle included a $9.33 million new build in Bella Collina and an $8.52 million home in Witherspoon. Homes above roughly $2 million trade on a longer timeline with a smaller, more patient buyer pool; the days-on-market figures in the priciest new-construction enclaves run from the mid-30s into the 60s. A $4 million home is not slow because it is mispriced, it is slow because the pool of buyers at that number is small and deliberate.
For a closer look at what is pushing the high end, see the new-construction subdivisions driving Brentwood’s top end: Rosebrooke, Witherspoon, and Governors Club.
How does Brentwood compare to Franklin right now?
Brentwood and Franklin are the two anchors of the Williamson County market, and they trade at nearly identical price per square foot. The entire difference in median is house and lot: Brentwood’s median home is larger, on a bigger lot, about 10 miles south of downtown against Franklin’s 20.
Franklin offers a wider entry-to-mid range and more total inventory; Brentwood offers the shorter commute and a deeper bench of large new-construction homes, with a higher floor on price. The companion read on the Franklin market breaks that submarket down the same way. Talk through which submarket fits your budget in a 15-minute call.
How does Williamson County sit against Davidson County?
At the county level, Brentwood is the high end of the high end. Davidson moves nearly twice the volume because it is a far larger, denser market, but it trades at roughly half the Williamson median because its housing stock is older, smaller, and on tighter lots.
In 25 years brokering Middle Tennessee, the durable characteristics that hold Brentwood demand have been consistent: large lots, the short commute corridor north into Nashville and the Cool Springs employment core, and a supply of new-construction homes that built-out Davidson neighborhoods structurally cannot add. School attendance-zone boundaries are a documented per-parcel characteristic buyers verify, the same way they verify lot size or flood designation, never a ranking or suitability claim.
What is on the market in Brentwood right now?
Closed data tells you what buyers paid; live listings tell you what they can buy today. Here is the current active inventory across Brentwood 37027, from the established sub-$1 million subdivisions to the new-construction luxury enclaves.
- List View
- Map View
- Grid View
-
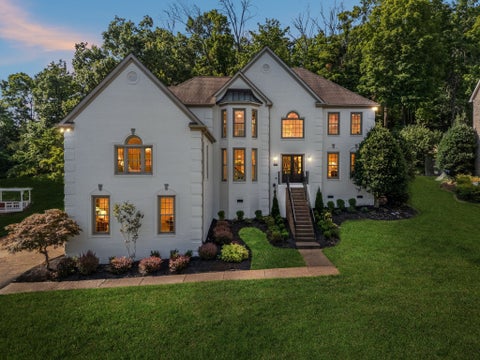
 $1,925,000
-
Lot Size22,216 sqft
-
Home Size4,316 sqft
-
Beds5 Beds
-
Baths4.5 Baths
-
Year Built1996
-
-
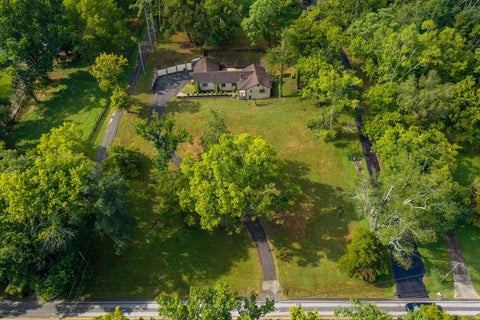 $1,299,000
-
Lot Size2.00 ac
-
Home Size2,472 sqft
-
Beds3 Beds
-
Baths2.5 Baths
-
Year Built1936
-
-
 $755,000
-
Lot Size11,762 sqft
-
Home Size3,118 sqft
-
Beds4 Beds
-
Baths2.5 Baths
-
Year Built2001
-
-
 $2,649,990
-
Lot Size26,136 sqft
-
Home Size5,176 sqft
-
Beds5 Beds
-
Baths5.5 Baths
-
Year Built2025
-
-
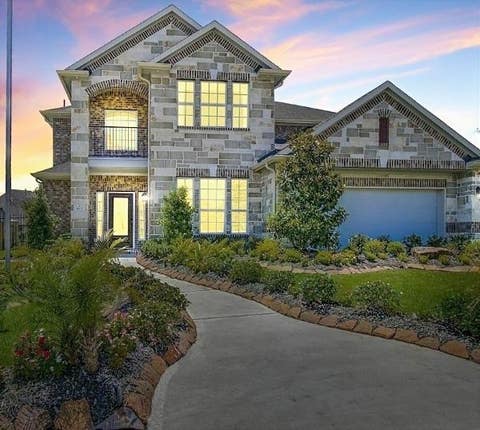 $1,950,321
-
Lot Size20,038 sqft
-
Home Size4,178 sqft
-
Beds4 Beds
-
Baths3.5 Baths
-
Year Built2025
-
-
 $4,199,900
-
Lot Size31,799 sqft
-
Home Size7,030 sqft
-
Beds6 Beds
-
Baths7 Baths
-
Year Built2026
-
-
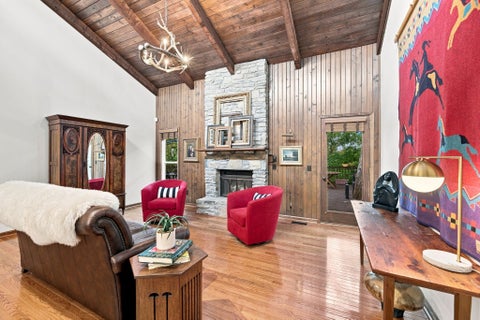 $869,000
-
Lot Size16,989 sqft
-
Home Size3,535 sqft
-
Beds4 Beds
-
Baths3.5 Baths
-
Year Built1984
-
-
 $2,996,994
-
Lot Size22,216 sqft
-
Home Size6,708 sqft
-
Beds5 Beds
-
Baths5.5 Baths
-
Year Built2026
-
-
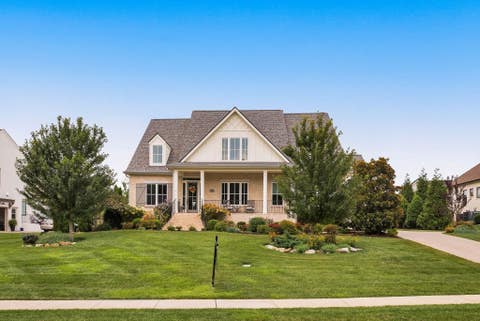 $2,299,000
-
Lot Size20,038 sqft
-
Home Size5,269 sqft
-
Beds5 Beds
-
Baths5.5 Baths
-
Year Built2019
-
-
 $900,000
-
Lot Size30,492 sqft
-
Home Size2,746 sqft
-
Beds4 Beds
-
Baths3.5 Baths
-
Year Built1987
-
-
 $2,495,000
-
Lot Size1.22 ac
-
Home Size4,122 sqft
-
Beds5 Beds
-
Baths5 Baths
-
Year Built2023
-
-
 $2,299,900
-
Lot Size43,560 sqft
-
Home Size4,875 sqft
-
Beds5 Beds
-
Baths5.5 Baths
-
Year Built2026
-
-
 $2,244,900
-
Lot Size23,523 sqft
-
Home Size4,991 sqft
-
Beds5 Beds
-
Baths5.5 Baths
-
Year Built2026
-
-
 $4,249,900
-
Lot Size32,670 sqft
-
Home Size6,912 sqft
-
Beds6 Beds
-
Baths7.5 Baths
-
Year Built2025
-
-
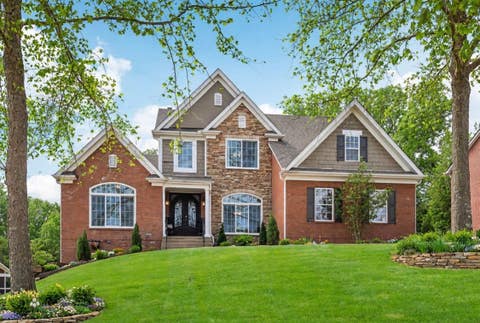 $1,185,000
-
Lot Size21,345 sqft
-
Home Size3,361 sqft
-
Beds4 Beds
-
Baths3.5 Baths
-
Year Built2004
-
See all Real estate matching your search.
(all data current as of
8/22/2026)
Listing information deemed reliable but not guaranteed. Read full disclaimer.
What am I watching in Brentwood for the rest of the year?
Here is what I am watching. First, whether the new-construction luxury pipeline in Rosebrooke, Governors Club, and Hampton Reserve keeps delivering, because that supply sets the top of the market and is what pushes single-family months-of-supply into buyer’s-market territory. Second, how the established sub-$1 million subdivisions absorb, since they are the only entry into the Brentwood ZIP and demand for them is the broadest in the market. Third, whether the price-per-foot gap between new construction and established stock holds near two-to-one.
Book a 15-minute Brentwood strategy call for my read on a specific subdivision or a new build. A short conversation usually beats a weekend of filtering listings.
Frequently asked questions
How much does a home in Brentwood, TN cost right now?
Over the trailing six months, 461 homes closed in Brentwood at a median price of $1,320,000 and $346 per square foot, on a median size of about 3,809 square feet. The middle half ran from roughly $810,000 to $2.1 million, with established subdivisions providing the entry under $1 million and new-construction enclaves running from $1.58 million to $4.32 million.
Why is Brentwood so much more expensive than most of Nashville?
The difference is house size, lot size, and build era. Brentwood’s $1,320,000 median runs about three times Davidson County’s $475,000 median because Brentwood carries larger homes on larger lots and a deep new-construction segment. On price per square foot the gap narrows to $346 against $275.
Can you buy a home in Brentwood under $1 million?
Yes, in the established subdivisions. Brentwood Pointe has closed in the $330,000 to $517,000 range on 1980s construction, Mooreland Estates near $510,000, and Courtside at Southern Woods near $920,000 on mid-2000s homes. The sub-$1 million inventory is almost entirely established resale; new construction starts well above that.
What is the difference between Brentwood and Franklin for buyers?
Both are Williamson County markets at nearly identical price per square foot ($346 vs $345), but Brentwood’s median is higher ($1,320,000 vs $949,995) because it carries larger homes on larger lots and sits closer to Nashville. Franklin offers a wider entry-to-mid range and more inventory.
Sources, methodology, and disclosure
Data sources. All-residential closed-sale counts, medians, price-per-square-foot, price-band distribution, and the sale-to-list ratio reference the Grant Hammond market engine trailing six-month closed-sale dataset (imported June 25, 2026; Brentwood n=461, all home types, zip 37027). Sale-to-list is the median of sale price divided by list price across those 461 closings (98.3%). The single-family market-pace figures shown in the live market block above (526 active, 271 single-family closings, about 11.6 months of supply) are filtered to single-family only via RealTracs IDX and will differ from the all-residential closed count. Per-subdivision build-year and days-on-market figures reference the RealTracs MLS May 2026 trailing-window pull. Median is used as the headline statistic because a heavy upper tail of high-value sales distorts the average. All figures are derived from these datasets; no values are estimated or invented.
Broker authority. Verified broker authority used: 25 years of Middle Tennessee brokerage and over $1 billion in career closings across Davidson and Williamson Counties.
Commission disclosure. Broker fees are not set by law and are fully negotiable. All commission and buyer-agency details should be discussed before contract.
Compliance disclaimer. This post is informational and is not legal, tax, or investment advice. Market data is a snapshot in time and changes weekly; specific pricing and timing decisions should be confirmed with current MLS data before listing or making an offer. School attendance-zone assignments are set and changed by Williamson County Schools and must be verified per parcel with the district.