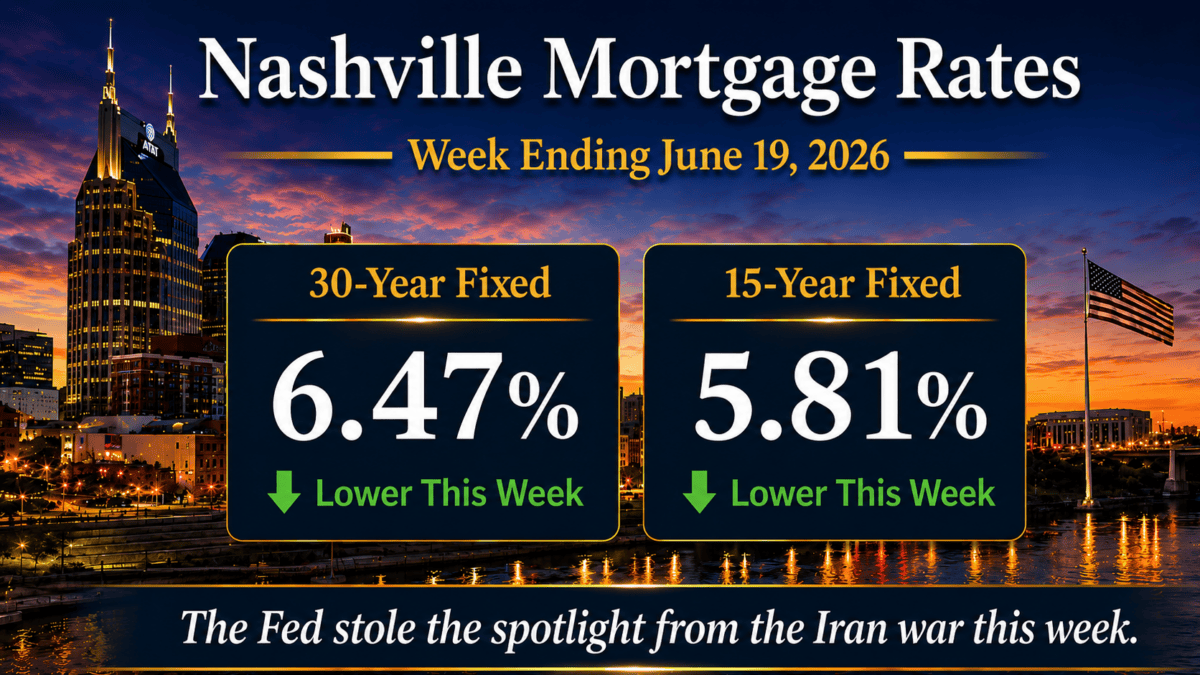
Nashville mortgage rates averaged 6.47% on the 30-year fixed and 5.81% on the 15-year fixed for the week ending June 19, 2026, per Freddie Mac PMMS. Both eased slightly, the 30-year down 5 basis points and the 15-year down 3. Rates finished about where they started, even through a hawkish Fed meeting and continued movement on the Iran peace deal.
“Once I rose above the noise and confusion, just to get a glimpse beyond this illusion. I was soaring ever higher, but I flew too high.” Carry On Wayward Son, Kansas.
The Fed stole the spotlight from the Iran war this week. In fact, a near-final peace deal had pushed yields to a one-month low by Tuesday. Then the first FOMC meeting under new Chair Kevin Warsh delivered a more hawkish dot plot, and longer-term rates sold off. Still, most of the damage reversed by Thursday. Mortgage rates track 5-year to 10-year Treasuries, not the Fed’s overnight rate, so they barely moved.
Of course, I anchor this report to the weekly Freddie Mac average, but the daily lender market is where buyers actually lock. For the running daily view, I keep a Nashville mortgage rate tracker with current 30-year, 15-year, FHA, and jumbo pricing.
In this report
Market Summary
- Nashville 30-year fixed mortgage rate averaged 6.47%, down from 6.52% the prior week (down 5 basis points).
- Nashville 15-year fixed mortgage rate averaged 5.81%, down from 5.84% the prior week (down 3 basis points).
- FHA 30-year mortgage rates were near 6.15% in daily lender pricing.
- The 10-year Treasury yield ended near 4.43%, after testing the 4.50% level mid-week.
- Mortgage spreads were near 2.04%, or 204 basis points.
- Federal Reserve policy remained restrictive: the FOMC held at 3.50% to 3.75% on June 17 and the dot plot turned more hawkish.
- Core CPI was 2.9% year over year on the May 2026 print, the most recent release.
- Year over year, the 30-year is down 34 basis points (from 6.81%) and the 15-year is down 15 basis points (from 5.96%).
The headline weekly averages come from the Freddie Mac PMMS, the standard 30-year and 15-year fixed-rate benchmark.
Mortgage Rate Dashboard
The mortgage rate dashboard shows a 6.47% 30-year fixed rate, a 5.81% 15-year fixed rate, an FHA 30-year rate near 6.15%, a 10-year Treasury yield near 4.43%, and a mortgage spread near 2.04% (204 basis points).
Nashville Mortgage Rates This Week
Nashville mortgage rates finished the week roughly flat, which is the story given how much crossed the wires. The Freddie Mac 30-year settled at 6.47%, down 5 basis points from 6.52%, and the 15-year at 5.81%, down 3 from 5.84%. The only real move came Wednesday after the Fed’s updated projections.
Meanwhile, daily pricing tells the sharper story. Quotes hit a one-month low Tuesday as the peace deal firmed. They spiked on the hawkish dot plot Wednesday, then recovered about half the move by Thursday. As a result, for buyers across Davidson and Williamson Counties, the week did not meaningfully change the payment math. Rates remain elevated against the past 10 months, but the week itself was quiet.
Institutional Macro Snapshot
10-Year Treasury Yield4.43%Down 3 bpsPrimary benchmark for mortgage rate direction.
30-Year Mortgage Rate (Freddie Mac)6.47%Down 5 bpsConsumer borrowing cost benchmark.
Mortgage Spread (30Y – 10Y)204 bpsDown 1 bpIndicates efficiency of mortgage-backed securities market.
Core CPI (YoY)2.9%Unchanged (May print)Sticky inflation limits rate improvement.
Federal Reserve Policy3.50% to 3.75%Held (hawkish)Maintains upward pressure on borrowing costs.
What Is Driving Mortgage Rates Right Now?
Three forces set the tone. In short, inflation feeds the Treasury, the Treasury feeds Nashville mortgage rates, and the spread decides how much of the move borrowers feel.
1. Treasury yields are setting the base rate
The 10-year Treasury tested 4.50% mid-week before easing to 4.43%, down about 3 basis points. However, that 4.50% mark has become a ceiling. Each push above it draws buyers, which pulls yields back and supports mortgage pricing. In addition, two tailwinds helped. The Iran de-escalation shed geopolitical risk premium, and crude oil kept retreating, easing a visible inflation input.
2. Mortgage spreads are shaping borrower pricing
The spread between the 30-year fixed and the 10-year held near 204 basis points, still wide against the 170 to 180 of a calmer market. That width is why the average mortgage tracks longer Treasuries, not the Fed’s overnight rate. It is also why rates did not spike on Fed day, even as short-term rate bets jumped. It sat at 205 in last week’s rate update and has not compressed for borrowers since.
3. Federal Reserve policy is keeping the rate floor elevated
At Warsh’s first meeting the Fed held at 3.50% to 3.75%, but the dot plot turned hawkish. The median 2026 projection rose to 3.625% from 3.375% in March. Nearly half the committee now sees two hikes by year end. Warsh called the projections written “in pencil, not in pen” but offered no dovish counterweight. Still, the nuance for borrowers is that the Fed controls overnight rates, not mortgages. If Warsh leans on balance sheet reduction over hikes, the longer-term bonds that drive Nashville mortgage rates could benefit.
The 10-Year Treasury and Mortgage Rate Spreads
The spread is the gap between the 30-year fixed and the 10-year Treasury, this week about 2.04%, or 204 basis points (6.47% minus 4.43%). However, it barely moved this week, down roughly 1 basis point, and remains wide. In other words, that extra width is borrower cost that has nothing to do with the Treasury itself.
The lesson I give clients is simple. Nashville mortgage rates can fall even when Treasury yields are flat, because a tightening spread does the work. This week the 10-year did the lifting and the spread sat still, so the small decline came from the Treasury side. If the spread compresses toward its norm, borrowers get a second leg of relief that does not depend on the Fed.
Payment Impact for Nashville Buyers
On the locked example I use each week, a $500,000 purchase with 20% down ($400,000 loan, 30-year fixed, taxes and insurance excluded):
- Last week at 6.52%: about $2,533.54 per month.
- This week at 6.47%: about $2,520.39 per month.
- Difference: about $13 lower, roughly $4,734 over the full term.
Similarly, at a $1,000,000 price (an $800,000 loan), the same move is worth about $26 a month. Year over year, the $400,000-loan payment is about $90 a month lower than at 6.81%. That is the number that matters for buyers who paused last summer. Condo buyers in downtown Nashville condos tend to act on that annual shift faster than on any weekly move. For investors weighing East Nashville homes, the weekly change does not move a DSCR calculation. The year-over-year decline does. As a result, with the spread wide, the deals that pencil are the ones where rent supports the payment at today’s pricing.
Strategic Borrower Considerations in Today’s Market
This week rewards borrowers who separate the weekly average from the daily lock market, because the two moved in opposite directions around the Fed.
- Buyers: the weekly average is lower, but daily quotes jumped on Fed day. If you are near a lock, watch the daily market and the 10-year around 4.50%. On an FHA condo, confirm the building is approved first; I keep the FHA-approved condo inventory current.
- Sellers: a 5-basis-point move does not change buyer payment math. Instead, price and condition carry the listing.
- Investors: spreads near 204 basis points keep financing costs above normal. Underwrite to today’s pricing, not a forecast. See the Nashville Airbnb financing options for current DSCR structures.
- Move-up buyers: the roughly $90 a month year-over-year savings on a $400,000 loan is real, but a hawkish dot plot caps near-term relief. Time the move to the home, not the headline.
I have brokered Middle Tennessee real estate for 25 years and more than $1 billion in closings. The constant through every rate cycle is the same. The buyers who do well act on the home and the payment they can carry today. In practice, what I watch most is the gap between the Friday survey and the daily lock market. I tell clients the average is context; the number that matters is the one their lender can lock this week.
Nashville Real Estate Market Outlook
The week ahead is heavy on inflation. Core PCE, the Fed’s preferred gauge, lands next week. It arrives alongside the Dallas Fed Trimmed Mean PCE, a measure Warsh favors as a cleaner read on persistent inflation. Treasury auctions will also test demand: strong demand supports bonds and rates, weak demand pushes yields up.
Further out, the June jobs report is due July 2, and the FOMC next meets July 28 to 29. Between now and then, the daily market that sets Nashville mortgage rates trades on data more than on any weekly average. For how this backdrop meets local inventory, see the Middle Tennessee market update. Overall, as the conflict fades and oil retreats, I expect focus to shift back to inflation, growth, and Fed policy.
Nashville Mortgage Rates FAQ
What are Nashville mortgage rates today?
For the week ending June 19, 2026, Nashville mortgage rates averaged 6.47% on the 30-year fixed and 5.81% on the 15-year, per Freddie Mac. Daily quotes were choppy around the Fed decision, so your quoted rate on a given day may differ from the weekly average.
Did Nashville mortgage rates go up or down this week?
On the weekly average, Nashville mortgage rates fell: the 30-year down 5 basis points, the 15-year down 3. However, daily pricing was more volatile, dipping Tuesday on the peace deal, then giving back ground after the hawkish Fed before recovering about half the move by Thursday.
Why did the Fed meeting move Nashville mortgage rates?
The Fed held at 3.50% to 3.75% on June 17, but its dot plot turned hawkish. The median 2026 projection rose to 3.625%, and nearly half the committee sees two hikes by year end. New Chair Kevin Warsh did not push back or offer guidance. Short-term rate bets jumped, but Nashville mortgage rates, which track longer bonds, moved far less.
What is the mortgage spread and why does it matter?
The mortgage spread is the gap between the 30-year fixed and the 10-year Treasury, this week about 204 basis points (6.47% minus 4.43%). Rates can fall even when Treasury yields are flat if the spread tightens. Still, a wide spread means borrowers pay more than the Treasury move alone suggests. A narrower spread is one of the clearest paths to lower Nashville mortgage rates.
How much does a 5-basis-point rate change affect a Nashville mortgage payment?
On a $400,000 loan (a $500,000 home with 20% down), this week’s move from 6.52% to 6.47% lowers principal and interest by about $13 a month, or roughly $4,734 over the full term. On an $800,000 loan it is about $26 a month. Still, small weekly moves rarely change a buying decision on their own.
When is the next event that could move mortgage rates?
Core PCE releases next week alongside the Dallas Fed Trimmed Mean PCE. After that, the June jobs report is due July 2, 2026, and the FOMC next meets July 28 to 29, 2026. In short, each tends to move the daily lender market more than the weekly Nashville mortgage rates average.
Sources, methodology, and disclosure
Data sources
- Freddie Mac Primary Mortgage Market Survey (PMMS), weekly 30-year and 15-year fixed averages: https://www.freddiemac.com/pmms
- FRED DGS10, 10-year Treasury Constant Maturity Rate (Board of Governors of the Federal Reserve System): https://fred.stlouisfed.org/series/DGS10
- Mortgage News Daily Rate Index, daily lender pricing (30-year, 15-year, FHA, jumbo): https://www.mortgagenewsdaily.com/mortgage-rates
- Federal Reserve FOMC Calendar and June 17, 2026 Summary of Economic Projections: https://www.federalreserve.gov/monetarypolicy/fomccalendars.htm
- Federal Reserve H.15 Selected Interest Rates (10-year Treasury daily close): https://www.federalreserve.gov/releases/h15/
- U.S. Department of the Treasury, Daily Treasury Par Yield Curve Rates: https://home.treasury.gov/resource-center/data-chart-center/interest-rates/TextView
- U.S. Bureau of Economic Analysis, Personal Consumption Expenditures price index (Core PCE): https://www.bea.gov/data/personal-consumption-expenditures-price-index
- U.S. Bureau of Labor Statistics, Employment Situation release schedule: https://www.bls.gov/schedule/news_release/empsit.htm
- U.S. Bureau of Labor Statistics, Consumer Price Index (May 2026 release, Core CPI YoY): https://www.bls.gov/cpi/
- Mortgage Bankers Association, Weekly Mortgage Applications Survey (via Mortgage News Daily aggregation): https://www.mortgagenewsdaily.com/mortgage-rates/mba
- RealTracs MLS aggregate and local lender conversations for Middle Tennessee builder buydown and concession observations.
Methodology
Rate data in this update reflects weekly averages from the Freddie Mac Primary Mortgage Market Survey (PMMS) for the week ending June 19, 2026. Daily lender pricing context is sourced from the Mortgage News Daily Mortgage Rate Index. Macro indicators including the 10-year Treasury yield reference Federal Reserve Economic Data (FRED) series DGS10. Spread analysis between Nashville mortgage rates and the 10-year Treasury uses the historical PMMS minus DGS10 series.
Payment figures use the standard amortization formula P times r times (1 plus r)^n divided by ((1 plus r)^n minus 1). The example is the locked $500,000 purchase, 20% down, $400,000 loan, 30-year term. Nashville-area builder buydown and concession observations reference active Middle Tennessee MLS data via the RealTracs system and conversations with local lenders. Year-over-year comparisons reference the same Freddie Mac PMMS week from the prior year.
Disclosures
About the broker. Verified broker authority: 25 years brokering Middle Tennessee real estate and over $1 billion in career closings at Compass RE with the BDG Partners team.
Commission and compensation disclosure. Broker fees are not set by law and are fully negotiable. All commission and buyer-agency details should be discussed before contract.
Mortgage compliance disclaimer. Mortgage rates change daily. The rates referenced above are the Freddie Mac PMMS weekly average for the week ending June 19, 2026. Daily lender quotes will differ based on credit profile, loan size, property type, and lock period. Nothing in this analysis constitutes a rate lock guarantee or a commitment to lend. Speak with a licensed mortgage professional for personalized pricing.
Forward-looking statement. Any commentary on where rates may go is a forward-looking statement based on current data and is inherently uncertain. Rate forecasts can be wrong, and nothing here should be read as a guarantee of future pricing or market direction.
Talk through your numbers
If you are weighing a purchase or refinance in Nashville or Middle Tennessee, I am glad to run your specific scenario, lock timing, and payment math. Reach out directly and we will work the numbers together.
More Nashville mortgage analysis
For the prior week’s report, see last week’s mortgage report. For the full archive of these Friday updates, see the weekly mortgage analysis archive.