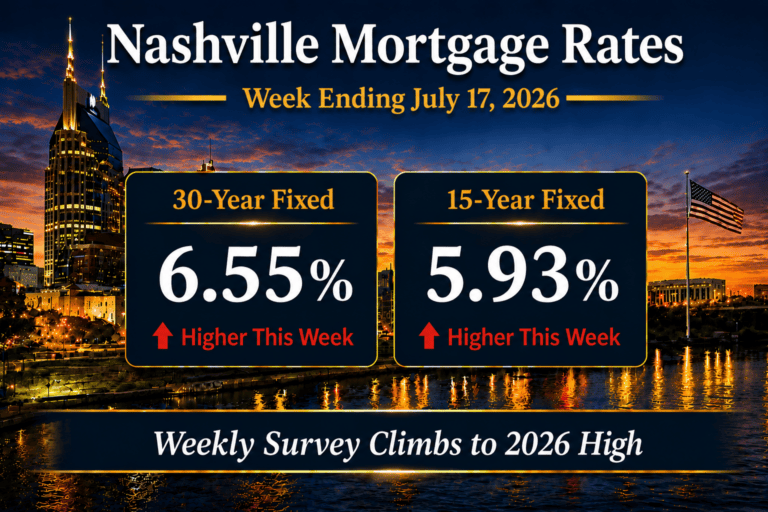
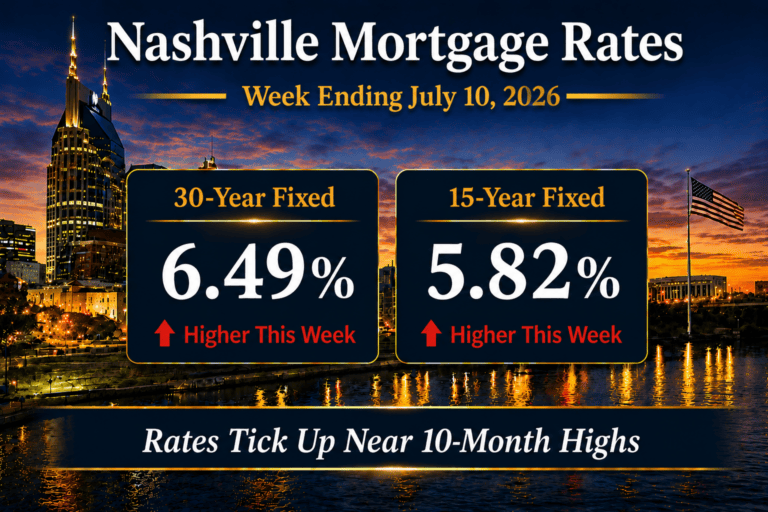
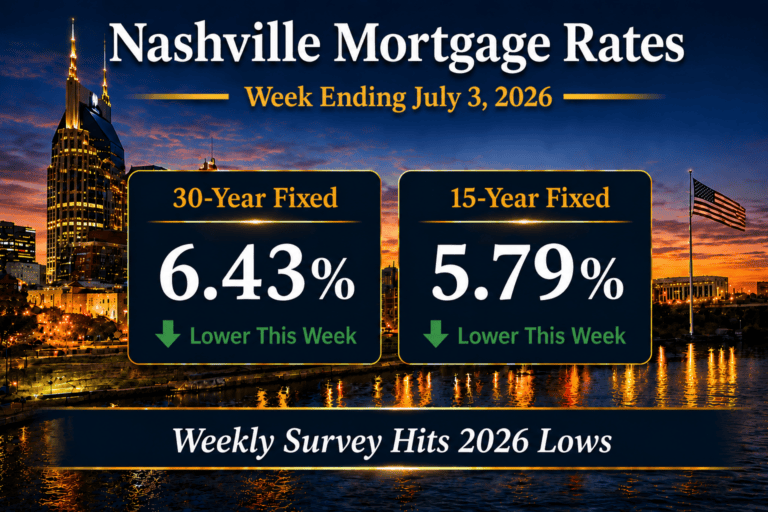
Nashville mortgage rates edged higher again for the week ending July 24, 2026, with the 30-year fixed averaging 6.58% and the 15-year fixed averaging 5.96%, according to Freddie Mac PMMS. Both benchmarks added 3 basis points week over week (from 6.55% and 5.93%), and daily lender pricing pushed to its highest level in just over a year, even though the 30-year survey still sits about 16 basis points below where it was a year ago.
The move traces back to one source: energy. A resurgence of hostilities in the Iran conflict pushed crude oil to roughly $90 a barrel, up from the $68 range just a few weeks ago, and that surge revived inflation concerns that fed straight into the bond market. With an unusually quiet economic calendar and no major Treasury auctions competing for attention, investors traded almost entirely on the geopolitical headlines this week, selling longer-term bonds and pushing yields higher. For context, the 10-year Treasury climbed to roughly 4.70% from about 4.56% the prior week, while the mortgage spread narrowed to roughly 1.88%, so the weekly survey held relatively steady even as the benchmark yield rose.
I keep the current week’s figures on our Nashville mortgage rate tracker, updated every Friday after the Freddie Mac release. This post is the weekly broker read on what the move means for buyers, sellers, and investors across Nashville and Middle Tennessee.
In this report
Market Summary
- Nashville 30-year fixed mortgage rate averaged 6.58%, up from 6.55% the prior week.
- Nashville 15-year fixed mortgage rate averaged 5.96%, up from 5.93% the prior week.
- FHA 30-year mortgage rates were near 6.40% on daily lender pricing.
- The 10-year Treasury yield ended near 4.70%, roughly 14 basis points above the prior week.
- Mortgage spreads were near 1.88%, or 188 bps, about 11 bps narrower week over week.
- Federal Reserve policy remained restrictive, with the federal funds rate held at 3.50% to 3.75%.
- Year over year, the 30-year fixed is about 16 bps lower and the 15-year is about 4 bps higher.
The 30-year and 15-year figures above are weekly averages from the Freddie Mac PMMS survey for the week ending July 24, 2026.
Mortgage Rate Dashboard
The mortgage rate dashboard shows a 6.58% 30-year fixed rate, a 5.96% 15-year fixed rate, an FHA 30-year rate near 6.40%, a 10-year Treasury yield near 4.70%, and a mortgage spread near 1.88%.
Nashville Mortgage Rates This Week
Rates rose for a third straight week, but the weekly survey understated what I watched happen in daily pricing. The 30-year fixed averaged 6.58%, up 3 basis points from 6.55% the prior week, and the 15-year fixed averaged 5.96%, up 3 basis points from 5.93%. That is a fresh high for the survey, though it remains about 16 basis points below where it was a year ago.
Daily lender pricing ran far hotter than the survey. The Mortgage News Daily 30-year index reached its highest level in just over a year on Thursday, with the average lender crossing 6.8% after sitting closer to 6.5% at the end of June. Friday brought a modest recovery, but the week still set a one-year high in daily pricing. The gap between the calm 6.58% weekly average and the hotter daily rate sheets meant the rate a buyer actually locked depended heavily on the day.
For Middle Tennessee buyers, that divergence is the real story. Daily rate sheets across Davidson and Williamson Counties moved up faster than the weekly average, so buyers shopping mid-week were quoting rates well above the 6.58% headline. When the daily index and the weekly survey pull apart like this, timing matters as much as the headline number.
Institutional Macro Snapshot
What Is Driving Mortgage Rates Right Now?
Three forces set the level of Nashville mortgage rates this week: the 10-year Treasury yield that anchors the base rate, the mortgage spread layered on top of it, and Federal Reserve policy that keeps the floor elevated. As I read the week, the Treasury did the heavy lifting and oil did the pushing, with energy-driven inflation fears driving yields higher while the spread absorbed part of the move. This follows the pattern from last week’s Nashville mortgage rate update, when rates rose to fresh 2026 highs.
1. Treasury yields are setting the base rate
The 10-year Treasury climbed to roughly 4.70% from about 4.56% the prior week, driven almost entirely by the oil-and-inflation story rather than any domestic data release. The technical picture matters just as much. Yields are now pressing against the 4.60% level that has repeatedly capped them, a ceiling that has held for close to two decades, and the 30-year Treasury has stayed above 5% for its longest stretch in roughly 20 years. A decisive break higher would mark a real shift in how the bond market behaves.
2. Mortgage spreads are shaping borrower pricing
The mortgage spread narrowed to about 1.88% (188 bps) from 1.99% (199 bps), which is why the weekly survey rose only 3 basis points even though the Treasury jumped about 14. A tighter spread cushioned borrowers this week and kept the survey from following the 10-year point for point. If the spread keeps compressing toward its long-run range, it becomes a source of rate relief that does not depend on the Treasury falling.
3. Federal Reserve policy is keeping the rate floor elevated
The federal funds rate held at 3.50% to 3.75%, and the next FOMC decision lands July 29, just days after this post. Markets are pricing roughly a 64% chance the Fed holds next week, so the bigger question is September: with oil adding inflation pressure, futures now imply better than a 70% chance of at least one rate hike by the September 16 meeting. Chair Kevin Warsh faces the awkward task of resisting the urge to tighten into an oil-driven inflation spike, and I will be listening to how he frames that, because it will move markets more than the decision itself.
The 10-Year Treasury and Mortgage Rate Spreads
Mortgage rates track the 10-year Treasury yield, then add a spread that covers the extra risk and servicing cost of a mortgage-backed security. This week the 10-year rose to near 4.70%, about 14 basis points above the prior week, while the 30-year fixed rose only to 6.58%.
That combination narrowed the spread. Using the standard measure, the mortgage spread equals the 30-year fixed rate minus the 10-year Treasury yield: 6.58% minus 4.70% is roughly 1.88%, or 188 basis points. That is about 11 basis points tighter than last week’s 1.99%, or 199 basis points.
The way I read it, the spread did most of the cushioning this week. A 14-basis-point jump in the Treasury would normally drag mortgage rates up sharply, but the spread compressed and absorbed most of the move, so the survey rose only 3 basis points. A spread that stays near or below 188 basis points is one of the clearest paths to lower rates for Nashville buyers, even if the Treasury stays elevated on the oil story.
Payment Impact for Nashville Buyers
When I run the payment math for buyers, the weekly move looks small on its own. On a $400,000 loan (a $500,000 purchase with 20% down, 30-year fixed, principal and interest only), the move from 6.55% to 6.58% raises the monthly payment from about $2,541.44 to about $2,549.35. That is roughly $7.91 more per month, or about $2,849 over the full 30-year term.
Middle Tennessee purchase prices scale that math up quickly. At this week’s 6.58% rate, a $500,000 loan runs about $3,186.69 per month in principal and interest, and a $1,000,000 loan runs about $6,373.38. Both are roughly $10 and $20 per month higher, respectively, than they would have been at last week’s 6.55%. On the larger balances common in Franklin, Brentwood, and Green Hills, three straight weeks of small increases add up faster than any single week’s number suggests, and the daily rate sheets buyers actually locked ran higher still.
For investors, the payment sensitivity is sharpest where the debt service has to clear against rental income, and that is where I spend the most time with clients in a week like this. Buyers weighing short-term rental cash flow in submarkets like East Nashville should run the current rate against realistic occupancy, because daily pricing at a one-year high can move a marginal deal from positive to break-even.
Strategic Borrower Considerations in Today’s Market
With the weekly survey at a fresh high, daily pricing running hotter, and the FOMC meeting only days away, the right move depends on which side of the transaction you are on. Here is how I am framing it for each group this week, with the July 29 Fed decision and the oil-driven volatility both arguing for tighter lock discipline.
- Buyers. Lock timing matters more when daily pricing is above the weekly average and a Fed meeting is imminent. If you are under contract or close to it, a lock removes the risk of another move before closing; floating only pays off if you expect a clear post-FOMC or oil-driven reversal.
- Sellers. Buyer payments are a little higher than three weeks ago, so pricing to the current rate environment and being ready to discuss concessions or a rate buydown keeps your listing competitive.
- Investors. Debt-service math is tighter at 6.58%. Underwrite to today’s rate, not to a hoped-for cut, and treat any later refinance as upside rather than the base case. For short-term rental purchases, our Nashville Airbnb financing guide covers DSCR and jumbo structures.
- Move-up buyers. The $750K to $1.5M band is the most rate-sensitive segment in Nashville. Running the payment on the new home against your current locked rate is the first conversation, before you list or shop.
Grant Hammond has 25 years of Nashville real estate experience and has closed over $1 billion in career sales across Davidson and Williamson Counties, including more than 350 downtown high-rise condominiums and 550-plus short-term rental transactions.
What I am telling clients this week is straightforward: this is an oil story, not a jobs or housing story, so the rate you see is only as steady as the next headline out of the Middle East. That argues for locking once you are under contract rather than betting on a calm week.
Nashville Real Estate Market Outlook
The near-term calendar is what I am watching, and it is busy. The Fed meets July 29, and with rates climbing alongside oil, any signal about the September path will matter more than the July decision itself. We also get the Fed’s once-preferred inflation gauge, Core PCE, along with the Dallas Fed Trimmed Mean PCE, either of which can move markets given how sensitive rates have become to inflation expectations.
As long as oil stays elevated and the Iran conflict stays unresolved, I expect rates to stay on edge, and the clearest path back down runs through lower energy prices. The flip side is the one piece of good news this week: because the move up was largely oil-driven, rates could recover a meaningful share of what they lost if crude eases, which is at least a path that depends on things that could actually change in the near term.
Locally, the Middle Tennessee market keeps absorbing this rate range. For the broader picture, see the weekly Nashville mortgage analysis archive, which tracks how each week’s print has moved through Davidson and Williamson County buyer activity.
Nashville Mortgage Rates FAQ
What are Nashville mortgage rates today?
For the week ending July 24, 2026, the Nashville 30-year fixed averaged 6.58% and the 15-year fixed averaged 5.96%, per Freddie Mac PMMS. Both rose 3 basis points from the prior week (6.55% and 5.93%). Daily lender pricing ran hotter, reaching a one-year high with the Mortgage News Daily 30-year index near 6.85%.
Did Nashville mortgage rates go up or down this week?
Up, and daily pricing hit a one-year high. The 30-year and 15-year fixed each rose 3 basis points on the weekly survey, a third straight weekly increase, while daily lender rates crossed 6.8%. The survey is now at a fresh high, though still about 16 basis points below a year ago on the 30-year.
Why did rates rise to a one-year high this week?
Energy. A resurgence in the Iran conflict pushed crude oil toward $90 a barrel from the $68 range a few weeks earlier, reviving inflation concerns that sold off the bond market. The 10-year Treasury climbed to about 4.70%, and mortgage rates followed, though a narrowing spread kept the weekly survey increase small.
How much does the rate increase change my monthly payment?
On a $400,000 loan, moving from 6.55% to 6.58% adds about $7.91 per month in principal and interest, roughly $2,849 over 30 years. On a $1,000,000 loan the weekly move is about $20 per month. The direction, held over several weeks and reflected in even hotter daily pricing, matters more than any single week.
What is the difference between the FHA and conventional 30-year rate?
This week FHA 30-year pricing was near 6.40% on daily lender sheets, close to the conventional 30-year survey average of 6.58%. FHA note rates often price slightly under conventional, but FHA loans carry mortgage insurance that changes the all-in cost, so compare the full payment, not just the rate.
Should I lock my rate now or wait?
This is a risk-management decision, not a forecast. With daily pricing at a one-year high, the move driven by oil that could reverse quickly, and a Fed decision on July 29, floating exposes you to headline risk in both directions. If you are under contract or close to it, locking removes that uncertainty; if your timeline is longer, talk through a lock-and-shop or float-down option with your lender rather than simply waiting.
Sources and methodology
Rate data in this update reflects weekly averages from the Freddie Mac Primary Mortgage Market Survey (PMMS) for the week ending July 24, 2026. Daily lender pricing context is sourced from the Mortgage News Daily Mortgage Rate Index. Macro indicators including the 10-year Treasury yield reference Federal Reserve Economic Data (FRED) series DGS10. Spread analysis between mortgage rates and the 10-year Treasury uses the historical PMMS minus DGS10 series. Nashville-area builder buydown and concession observations reference active Middle Tennessee MLS data via the RealTracs system and conversations with local lenders. Year-over-year comparisons reference the same Freddie Mac PMMS week from the prior year.
- Freddie Mac Primary Mortgage Market Survey (PMMS), week ending July 24, 2026. https://www.freddiemac.com/pmms. Retrieved July 24, 2026.
- Mortgage News Daily, Mortgage Rate Index (daily lender pricing). https://www.mortgagenewsdaily.com/mortgage-rates. Retrieved July 24, 2026.
- Federal Reserve Economic Data (FRED), 10-Year Treasury Constant Maturity Rate, series DGS10. https://fred.stlouisfed.org/series/DGS10. Retrieved July 24, 2026.
- Federal Reserve FOMC calendar (next meeting July 28 to 29, 2026). https://www.federalreserve.gov/monetarypolicy/fomccalendars.htm. Retrieved July 24, 2026.
- U.S. Bureau of Labor Statistics, Employment Situation release schedule (next release August 7, 2026). https://www.bls.gov/schedule/news_release/empsit.htm. Retrieved July 24, 2026.
- U.S. Bureau of Labor Statistics, Consumer Price Index (Core CPI YoY). https://www.bls.gov/cpi/. Retrieved July 24, 2026.
- Mortgage Bankers Association, Weekly Applications Survey. https://www.mba.org/news-and-research/research-and-economics/single-family-research/weekly-applications-survey. Retrieved July 24, 2026.
- RealTracs MLS, active Middle Tennessee listing and concession data (Davidson and Williamson Counties). Retrieved July 24, 2026.
Verified broker authority used: 25 years of Middle Tennessee brokerage, $1 billion-plus in career closings, 350-plus downtown high-rise condo transactions, and 550-plus short-term rental transactions.
Commission and compensation disclosure. Broker fees are not set by law and are fully negotiable. All commission and buyer-agency details should be discussed before contract. Grant Hammond is a licensed real estate broker at Compass RE (TN Broker #261980); this analysis is not a solicitation of business already under a listing or buyer-agency agreement.
Rate disclosure. Mortgage rates change daily. The rates referenced above are the Freddie Mac PMMS weekly average for the week ending July 24, 2026. Daily lender quotes will differ based on credit profile, loan size, property type, and lock period. Nothing in this analysis constitutes a rate lock guarantee or a commitment to lend. Speak with a licensed mortgage professional for personalized pricing.
Forward-looking statement. Any outlook or forward-looking commentary in this post reflects current conditions and available data as of July 24, 2026 and is subject to change. It is not a prediction, guarantee, or investment advice. Rate direction depends on economic data, Federal Reserve policy, energy prices, and market conditions that can shift without notice.
More Nashville mortgage analysis
- Nashville Mortgage Rates Today, the live weekly rate tracker.
- Weekly mortgage rate archive, every Friday’s analysis.
- Last week’s Nashville mortgage rate update for the prior week’s read.