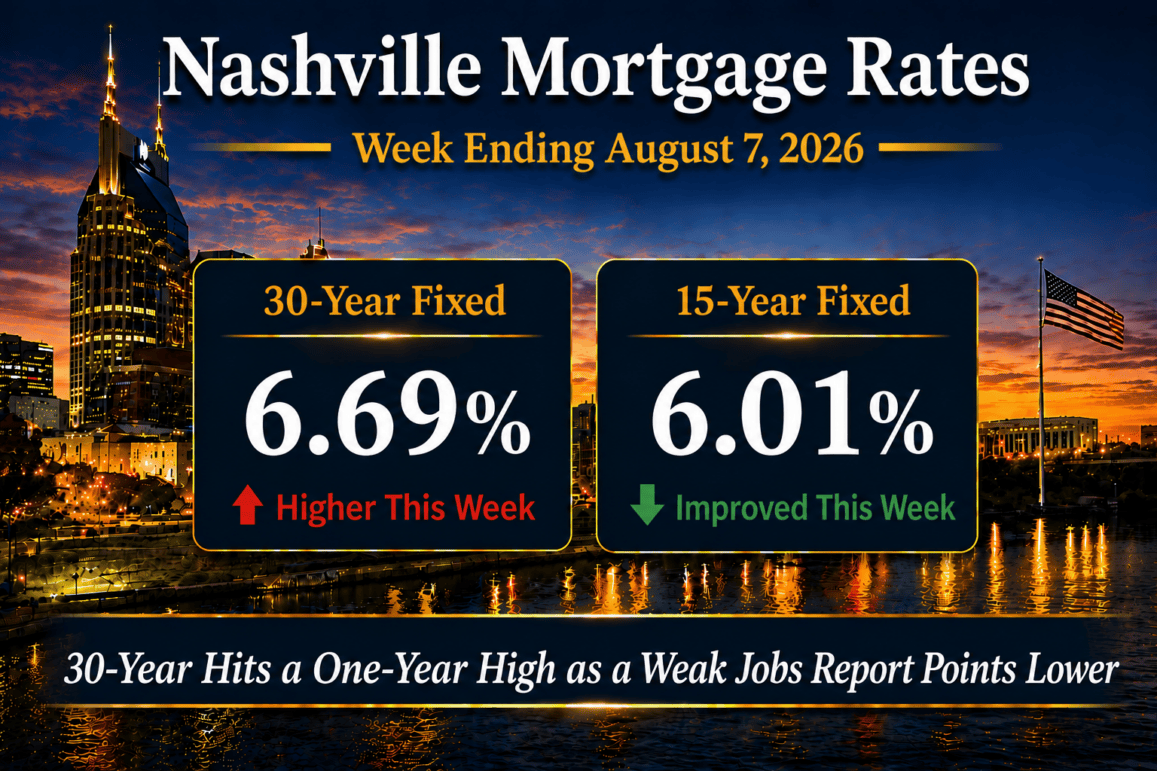
Nashville mortgage rates averaged 6.69% on the 30-year fixed and 6.01% on the 15-year fixed for the week ending August 7, 2026, according to Freddie Mac PMMS. The 30-year rose three basis points from 6.66% to a fresh one-year high, while the 15-year eased three basis points from 6.04%. The rate sheet is sitting at the top of its one-year range even as a weak July jobs report opened the door to a different story ahead.
Underneath the headline, the week was a tug of war. Lower oil and calmer currency markets pulled rates down midweek. Meanwhile, sticky inflation near 2.6%, a wide mortgage spread, and heavy new debt supply kept the 30-year pinned near its highs. Then the July jobs report landed this morning, August 7, 2026. It showed the economy lost 23,000 jobs against expectations for an 80,000 gain, and revisions lopped another 103,000 off May and June. A softer labor market is generally supportive of lower rates over time. Still, it arrived too late to move this week’s survey.
For buyers across Davidson and Williamson Counties, the practical read is a split screen. The weekly survey sits at a one-year high, but daily lender pricing actually fell through the week to its lowest since July 20, 2026, and the survey is basically reporting last week’s mood with this week’s confidence. I keep the running weekly figures on our Nashville mortgage rate tracker, and this post is the week-ending read on what moved and what it means locally.
In this report
Market Summary
- Nashville 30-year fixed mortgage rate averaged 6.69%, up from 6.66% and at a one-year high.
- Nashville 15-year fixed mortgage rate averaged 6.01%, down from 6.04% the prior week.
- FHA 30-year mortgage rates were near 6.33% on daily lender pricing.
- The 10-year Treasury yield ended near 4.66%, roughly unchanged on the week.
- Mortgage spreads were near 2.03%, or 203 bps, about 3 bps wider on the week.
- Federal Reserve policy remained restrictive, with the target range held at 3.50% to 3.75%.
- The July employment report showed a net loss of 23,000 jobs, a signal the labor market is cooling.
Weekly averages are published by Freddie Mac PMMS, with daily lender pricing and Treasury context from the sources listed at the end of this report.
Mortgage Rate Dashboard
The mortgage rate dashboard shows a 6.69% 30-year fixed rate, a 6.01% 15-year fixed rate, an FHA 30-year rate near 6.33%, a 10-year Treasury yield near 4.66%, and a mortgage spread near 2.03%.
Nashville Mortgage Rates This Week
The 30-year fixed averaged 6.69% and the 15-year fixed averaged 6.01% for the week ending August 7, 2026. The 30-year set a fresh one-year high. Meanwhile, the 15-year eased three basis points, so the two moved in opposite directions by the same small amount. A year ago the 30-year sat near 6.72% and the 15-year near 5.85%. As a result, the annual comparison is essentially flat on the long rate and modestly higher on the shorter term.
Because Freddie Mac’s weekly average captures Monday through Wednesday pricing, it has not caught up to the daily move. Instead, daily lender pricing tracked by Mortgage News Daily fell almost every day this week on lower oil, and again Friday on the soft jobs report. By Friday it had reached its lowest level since July 20, 2026. A Thursday uptick tied to a large corporate bond offering was the only interruption.
For the Middle Tennessee buyers I am advising, the takeaway is that the weekly survey sits at the top of its one-year range while the daily rate a borrower would actually be quoted improved to a three-week low by Friday. In short, if the daily trend holds, the survey should catch down to it next week.
Institutional Macro Snapshot
What Is Driving Mortgage Rates Right Now?
Three forces set the week, and they did not all pull the same way. Inflation expectations, the labor market, and the supply of new bonds each fed into the 10-year Treasury and the mortgage spread, with the Federal Reserve holding the floor. Here is how I read each for Nashville borrowers.
1. The labor market and the July jobs report
The July employment report released this morning, August 7, 2026, was the week’s biggest event. The economy lost 23,000 jobs against expectations for an 80,000 gain, and payrolls for May and June were revised down a combined 103,000. Oddly, the unemployment rate slipped 0.1% to 4.1%. That was not good news in disguise, because much of the drop came from roughly 264,000 people leaving the labor force rather than from stronger hiring, and wage growth kept cooling. In other words, the economy lost jobs and the unemployment rate fell in the same report, which is a useful reminder of how much faith to put in any single month. Markets now weight the unemployment rate heavily, so that decline tempered what a negative payroll print would traditionally have delivered as a rate rally.
A softer labor market is generally supportive of lower mortgage rates over time and raises the odds the Fed eases at its September 15 and 16, 2026 meeting. It landed after the survey window, so Nashville borrowers did not see it in this week’s 6.69% rate.
2. Oil, geopolitics, and the inflation path
Energy prices remain one of the biggest drivers of sentiment. Cautious optimism around the US and Iran situation and the reopening of the Strait of Hormuz, including reports that Iran may allow European nations to help clear mines, pushed crude back into the mid-$70 per barrel range after touching roughly $120 earlier this spring. As a result, lower oil eased inflation concerns and helped both stocks and rates improve midweek. In addition, calmer Japanese yen markets removed another quiet source of upward pressure on long-term yields. This is the improvement that ran into a wall when heavier bond supply arrived, which follows the pattern from last week’s Nashville mortgage rate update.
3. Treasury supply and corporate issuance
The steady supply of new government debt continues to be a headwind for long-term rates. Bonds dislike competing with more bonds, which is the polite way of saying the market can only absorb so much at once. This week a large Alphabet corporate bond offering piled on, competing for the same investor demand, nudging yields higher and keeping the mortgage spread wide near 203 basis points. As long as Washington keeps issuing debt faster than buyers care to absorb it, the bond market may keep demanding higher yields. That is a big part of why a flat 10-year did not translate into a lower Nashville rate sheet this week.
The 10-Year Treasury and Mortgage Rate Spreads
Mortgage rates track the 10-year Treasury, not the federal funds rate, so the yield near 4.66% is the number to watch. It fell for most of the week on lower oil. Then it ticked up Thursday when a large corporate bond offering added supply, before dropping again Friday after the jobs report. Overall, it finished near 4.66% and roughly flat on the week, even as daily mortgage pricing improved to a three-week low.
The mortgage spread is the 30-year fixed rate minus the 10-year Treasury yield. This week that math was 6.69% minus 4.66%, a spread of about 2.03%, or 203 basis points. Still, that is a few basis points wider than the prior week and well inside the 246 basis point average recorded since Freddie Mac changed the PMMS methodology in November 2022.
The practical point I make to borrowers is that rates can fall even when Treasury yields are flat, but only if the spread compresses. This week it did the opposite. Until mortgage-backed securities demand improves and the spread narrows back toward its long-run range, Nashville borrowers will keep paying more than the underlying benchmark alone would imply.
Payment Impact for Nashville Buyers
When I run the numbers for a buyer at a 6.69% 30-year fixed rate, principal and interest on a $500,000 loan land near $3,223 per month. For comparison, on a $1,000,000 loan, common in the Green Hills and Belle Meade price bands, principal and interest run about $6,446 per month. These figures exclude taxes, insurance, and any HOA dues, and assume a fully amortizing 30-year loan.
The three basis point move this week is small in payment terms, roughly $10 per month per $500,000 borrowed versus the prior week. However, the more useful comparison is that the 30-year is now at a one-year high. For that reason, the affordability math is at its tightest point in twelve months. For investors weighing DSCR and jumbo loan structures, the payment math on non-owner-occupied deals moves the same direction, with its own pricing add-ons.
The FHA 30-year near 6.33% remains the lower entry point for buyers using that program, and it pairs with the FHA-approved condo inventory downtown. Meanwhile, in the entry and mid-market segments across East Nashville homes, a rate at the top of its range is where a lender relationship and a sharp offer strategy matter most.
Strategic Borrower Considerations in Today’s Market
When rates sit at a one-year high but the forward signals are turning, timing the exact top or bottom is a low-value exercise. Calling the bottom is a hobby, not a strategy. In my 25 years working Middle Tennessee financing, the borrowers I see do well in this kind of week are the ones positioned to lock quickly if next week’s inflation data delivers a friendly surprise, because those windows have been short in 2026.
Next week brings the July CPI and PPI inflation reports, and those prints will move rates more than anything that happened this week. A cooler reading would support lower rates and reinforce the easing case the jobs report started. A hotter reading would revive talk of a higher-for-longer stance, or even a September hike, and could widen the spread further. A rate lock with a float-down option is worth discussing with your lender before those releases, not after.
For buyers, the message is that today’s opportunity is less about waiting for a perfect rate and more about being positioned to act. Partnering with a lender and a broker who understand the financing solutions available right now is the practical edge in a market where the rate sheet can change between the offer and the close.
Nashville Real Estate Market Outlook
The week ahead shifts into a higher gear. The July Consumer Price Index and Producer Price Index reports are the marquee events, and they are the first inflation readings new Fed Chair Kevin Warsh will weigh heading into September. If inflation runs hot, expect talk of a potential September rate hike to gain momentum. Cooler readings would do the opposite and support lower rates. Either way, forecasting the Fed a month out has a mixed track record, mine included. Retail Sales will also land as a read on consumer health, which still accounts for roughly two-thirds of U.S. economic activity, and a series of Treasury auctions will keep testing appetite for new government debt.
The next employment report, covering August, releases September 4, 2026, and the next FOMC decision follows on September 16, 2026 with an updated Summary of Economic Projections. As a result, the market spends the next several weeks pricing the odds of a September move. Every inflation and jobs surprise will swing the 10-year and the mortgage rate with it.
For Middle Tennessee, a cooling labor market that eventually nudges the Fed toward easing would improve affordability and pull sidelined buyers back into Davidson and Williamson County inventory. For now, rates are at a one-year high. I am watching the CPI print first, the spread second, and the September Fed meeting third. That is the order in which they matter for the rate a Nashville buyer actually locks.
Nashville Mortgage Rates FAQ
What are Nashville mortgage rates today?
For the week ending August 7, 2026, the 30-year fixed averaged 6.69% and the 15-year fixed averaged 6.01% per Freddie Mac PMMS. FHA 30-year pricing was near 6.33% on daily lender sheets. Daily quotes vary by credit profile, loan size, and property type.
Did mortgage rates go up or down this week?
On the weekly Freddie Mac survey the 30-year rose three basis points from 6.66% to a one-year high and the 15-year fell three basis points from 6.04%. Daily lender pricing tracked by Mortgage News Daily actually fell most days and ended at its lowest since July 20, so the weekly survey is lagging the daily improvement.
What is a mortgage spread and why does it matter?
The mortgage spread is the 30-year fixed rate minus the 10-year Treasury yield, near 2.03% or 203 basis points this week. Because it sits inside the 246 basis point average recorded since the November 2022 PMMS methodology change, borrowers are not paying an unusual premium over the benchmark, though this week the spread widened rather than compressed.
How much does a 30-year mortgage cost per month in Nashville right now?
At 6.69%, principal and interest run about $3,223 per month on a $500,000 loan and about $6,446 per month on a $1,000,000 loan, excluding taxes, insurance, and HOA dues. FHA financing near 6.33% lowers the entry payment for eligible buyers.
Will the Federal Reserve cut rates in September?
The Fed held its range at 3.50% to 3.75% on July 29, 2026. The weak July jobs report raises the odds of easing at the September 16, 2026 meeting, but if the July CPI and PPI reports next week run hot, a hold or even hike talk could return.
Should I lock my rate now or wait?
With inflation data due next week and rates at a one-year high, a rate lock plus a float-down option is worth discussing with your lender before those releases rather than after. Timing the exact bottom has been difficult in 2026 because favorable windows have been short. This is general information, not personalized lending advice.
Sources and methodology
Rate data in this update reflects weekly averages from the Freddie Mac Primary Mortgage Market Survey (PMMS) for the week ending August 7, 2026. Daily lender pricing context is sourced from the Mortgage News Daily Mortgage Rate Index. Macro indicators including the 10-year Treasury yield reference Federal Reserve Economic Data (FRED) series DGS10. Spread analysis between mortgage rates and the 10-year Treasury uses the historical PMMS minus DGS10 series. Employment figures reference the U.S. Bureau of Labor Statistics July Employment Situation released August 7, 2026. Nashville-area builder buydown and concession observations reference active Middle Tennessee MLS data via the RealTracs system and conversations with local lenders. Year-over-year comparisons reference the same Freddie Mac PMMS week from the prior year.
Data sources
- Freddie Mac Primary Mortgage Market Survey (PMMS), retrieved August 7, 2026. https://www.freddiemac.com/pmms
- FRED DGS10, 10-Year Treasury Constant Maturity Rate, retrieved August 7, 2026. https://fred.stlouisfed.org/series/DGS10
- Mortgage News Daily Mortgage Rate Index, retrieved August 7, 2026. https://www.mortgagenewsdaily.com/mortgage-rates
- Federal Reserve FOMC Calendar, retrieved August 7, 2026. https://www.federalreserve.gov/monetarypolicy/fomccalendars.htm
- U.S. Bureau of Labor Statistics, Employment Situation schedule and July 2026 release, retrieved August 7, 2026. https://www.bls.gov/schedule/news_release/empsit.htm
- U.S. Bureau of Labor Statistics, Consumer Price Index (Core CPI), retrieved August 7, 2026. https://www.bls.gov/cpi/
- Federal Reserve H.15 Selected Interest Rates, retrieved August 7, 2026. https://www.federalreserve.gov/releases/h15/
- RealTracs MLS, Middle Tennessee active and closed data, aggregate pull, August 2026.
Verified broker authority used: 25 years of Middle Tennessee brokerage and over $1 billion in career closings at Compass RE.
Disclosures
Commission and compensation disclosure. Broker fees are not set by law and are fully negotiable. All commission and buyer-agency details should be discussed before contract.
Mortgage compliance disclaimer. Mortgage rates change daily. The rates referenced above are the Freddie Mac PMMS weekly average for the week ending August 7, 2026. Daily lender quotes will differ based on credit profile, loan size, property type, and lock period. Nothing in this analysis constitutes a rate lock guarantee or a commitment to lend. Speak with a licensed mortgage professional for personalized pricing.
Forward-looking statement. This analysis includes forward-looking observations about interest rates and market conditions that can shift without notice. It is informational and is not a forecast, an investment recommendation, or a guarantee of future results.
More Nashville mortgage analysis
For the running weekly figures, see the Nashville Mortgage Rates Today hub. Prior weekly reads are archived in the Mortgage Rates and Financing category.