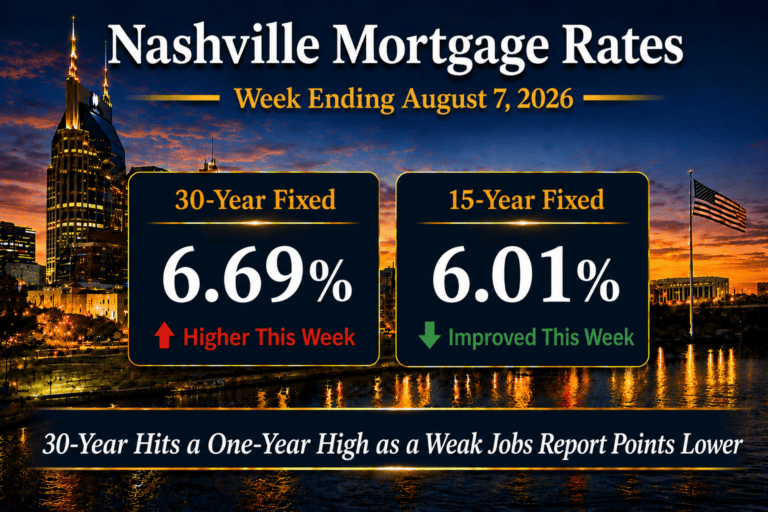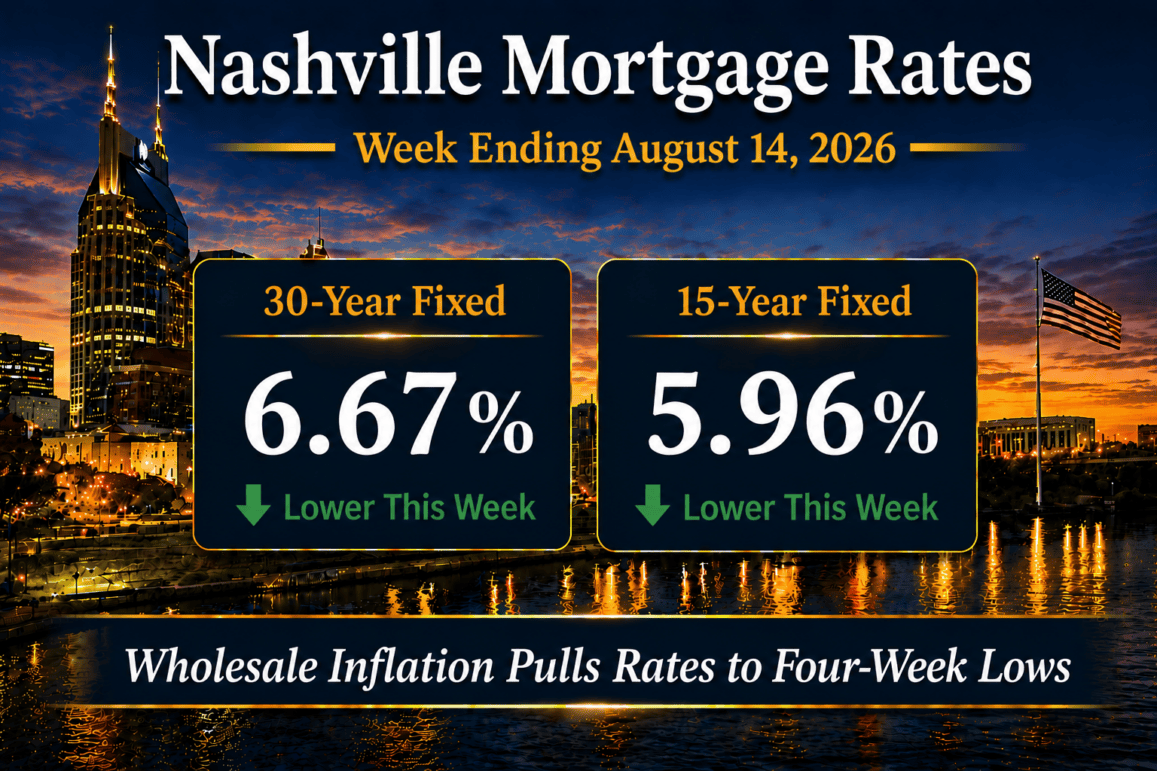
Nashville mortgage rates eased this week, with the 30-year fixed averaging 6.67% and the 15-year fixed averaging 5.96% for the week ending August 14, 2026, according to the Freddie Mac Primary Mortgage Market Survey. The 30-year fell 2 basis points from 6.69% and the 15-year fell 5 basis points from 6.01%, pulling both off the one-year highs set the prior week.
Rates continue to hover just beneath one-year highs in what was a packed news week. “I can see clearly now, the rain is gone. I can see all obstacles in my way,” Johnny Nash sang in 1972, and that is roughly where the bond market sits after two clean inflation prints. The obstacles are visible: Treasury supply, oil near $80 with the Strait of Hormuz still in play, and a 10-year Note that finished the week moving away from 4.60% rather than toward it. What cleared the clouds was Thursday’s wholesale inflation reading.
I publish this read every Friday because the weekly survey and the daily rate sheet do not move at the same speed, and the gap between them is where borrowers get surprised. For the running figures between these posts, the Nashville mortgage rate tracker carries the current week’s dashboard and payment math.
In this report
Market Summary
- Nashville 30-year fixed mortgage rate averaged 6.67%, down from 6.69% the prior week.
- Nashville 15-year fixed mortgage rate averaged 5.96%, down from 6.01% the prior week.
- FHA 30-year mortgage rates were near 6.28% on daily lender pricing.
- The 10-year Treasury yield ended near 4.70%, up about 4 basis points on the week after Friday’s selloff.
- Mortgage spreads were near 1.97%, or 197 basis points, tighter by 6 basis points.
- Federal Reserve policy remained restrictive, with the target range held at 3.50% to 3.75%.
- Core CPI for July 2026 eased to 2.5% year over year from 2.6%, and producer prices came in tame.
Weekly survey figures come from the Freddie Mac PMMS, which prices conventional, conforming, fully amortizing purchase loans for borrowers putting 20% down with excellent credit. Nashville borrowers with different credit profiles, loan sizes, or property types will see quotes above or below these averages.
Mortgage Rate Dashboard
The mortgage rate dashboard shows a 6.67% 30-year fixed rate, a 5.96% 15-year fixed rate, an FHA 30-year rate near 6.28%, a 10-year Treasury yield near 4.70%, and a mortgage spread near 1.97%, as of the week ending August 14, 2026.
Nashville Mortgage Rates This Week
Rates fell on both fixed terms. The 30-year came off 6.69% to 6.67%, a 2 basis point move, and the 15-year gave back 5 basis points to 5.96%. That reverses part of the run-up that carried the 30-year to a one-year high the week prior. Sam Khater, Freddie Mac’s chief economist, called the week relatively stable and pointed to recent increases in purchase and refinance applications as evidence that borrowers respond to even modest rate changes.
How the week actually unfolded
Daily pricing tells a more useful story than the weekly survey. It shows where the week turned. It did not start well. Monday brought a sharp move higher in oil and bond yields. Hopes for a United States and Iran peace deal faded, and meanwhile the risk of a prolonged blockade of the Strait of Hormuz rose. Prices stabilized Tuesday morning, and the bond market spent the rest of the day positioning for the week’s two inflation reports. Wednesday’s Consumer Price Index then came in almost perfectly in line, which normally would be fine, except bonds had positioned for something better and edged back toward higher rates by the close.
Thursday was the turn. July’s Producer Price Index came in slightly below forecasts across several key areas, a real achievement given the fuel prices July carried. Yields dropped sharply and mortgage rates hit their lowest levels since July 17. Friday’s retail sales then came in far below forecasts. At first glance, that should have pushed rates lower still. It did not, because the market discounted the print: most of the decline traced to Amazon Prime Day timing effects, and the drop in fuel sales was distorted by seasonal factors. Adjusted for both, the market read the data as decent and yields moved back up to mid-week highs.
Borrowers were largely spared that reversal. Mortgage-backed securities held up better than 10-year Treasuries through Friday, and the average lender had not fully passed Thursday’s rally into rate sheets to begin with, so Friday’s pricing came in only modestly higher. Thursday and Friday were effectively the lowest rates since July 17. Rates remain elevated in a general sense. They are just less elevated than they were two weeks ago.
Where rates sit year over year
Year over year the comparison is still slightly unfavorable. The 30-year sat at 6.58% a year ago, so today’s borrower is paying 9 basis points more than the same borrower in August 2025. The 15-year has widened more, up 25 basis points from 5.71%. Across the Middle Tennessee files I am tracking right now, that difference is small enough that it is not what is holding deals up. Price and inventory are.
Institutional Macro Snapshot
What Is Driving Mortgage Rates Right Now?
Three forces set the price of a Nashville mortgage this week, and only one of them was working for borrowers. Inflation data improved on both the consumer and the wholesale side, Treasury supply capped how much of that improvement bonds could keep, and oil stayed high enough to matter. Here is what I am watching in each.
1. Consumer and producer inflation both came in tame
Consumer prices came in almost perfectly in line on Wednesday. That reads as good news and mostly is, though a bond market positioned for something better treated it as a disappointment and gave back ground by the close. The trend underneath the single print is what matters. Core CPI for July 2026 landed at 2.5% year over year, down from 2.6%. Meanwhile, the month-over-month pace and the three-month annualized pace are both running at or below the Federal Reserve’s 2% target. If those trends hold, the case that the Fed’s next move could be a hike gets progressively harder to make.
Thursday’s Producer Price Index did the real work. PPI measures inflation at the wholesale level, meaning what businesses pay before those costs reach the consumer. July’s reading came in slightly below forecasts across several key areas. That happened despite the higher fuel prices the month carried. Producer prices are a look down the pipeline: when business costs rise quickly, some of that reaches consumers later, so a tame reading relieves pressure before it arrives. Bond yields dropped sharply on the release. Taken with the consumer reading, it becomes increasingly difficult to argue that higher rates are still needed to fight inflation.
2. Treasury supply is capping the improvement
Inflation helped bonds. Supply limited how much of that help stuck. The market had to absorb a large slug of new Treasury issuance this week, and there is an old saying on the desk that bonds hate more bonds. More supply weighs on prices and pushes yields, and therefore mortgage rates, higher. Deficit spending and the issuance it requires remain a structural headwind for the bond market. Consequently, a genuinely good inflation week produced only a 2 basis point improvement on the survey rate rather than ten. This is the same dynamic I flagged in last week’s rate read, running in the opposite direction.
3. Oil near $80 is still the swing factor
Oil continues to hover around $80 a barrel. That is well off its recent highs. Still, it sits meaningfully above the high $60s where it traded when the conflict between the United States and Iran began. Monday showed how fast this can turn: oil and bond yields both moved sharply higher as hopes for a peace deal faded and the risk of a prolonged blockade of the Strait of Hormuz increased. Prices stabilized by Tuesday, which is the only reason the bond market had room to trade the inflation data at all. Oil matters every week because energy costs feed directly into inflation expectations, and as oil goes, long-term rates tend to follow. A sustained move back toward the high $60s would do more for the 30-year fixed than another month of in-line CPI reports. Oil also matters more to this market than the national commentary suggests. Middle Tennessee buyers commute, so a fuel spike reaches them twice: once at the pump, and once through the rate.
The 10-Year Treasury and Mortgage Rate Spreads
The mortgage spread is the 30-year fixed rate minus the 10-year Treasury yield. This week the spread was approximately 1.97%, based on a 6.67% Freddie Mac 30-year fixed rate and a 4.70% 10-year Treasury yield. A week earlier it was 2.03%, from a 6.69% rate and a 4.66% yield. The spread compressed by 6 basis points.
That compression is the only reason the survey rate improved at all. The 10-year finished the week about 4 basis points higher, which on its own would have pushed the 30-year up rather than down. There is a mechanical explanation. Mortgage-backed securities held up better than 10-year Treasuries through Friday’s selloff. In addition, the average lender had not fully passed Thursday’s rally into rate sheets. As a result, lender pricing gave back less than the benchmark did. Borrowers got a 2 basis point improvement out of a week in which their benchmark went the wrong way. At 197 basis points the spread is still roughly 15 to 25 basis points above its long-run norm, which is excess cost sitting on top of every Nashville borrower’s rate.
The 4.60% line on the 10-year is the one that matters, and a trend nineteen years in the making now looks likely to hold rather than break. The last time the 10-year Note touched 4.60% and then traded above 4.60% three months later was 2007. That streak ends only if the yield drops beneath 4.60% and stays there by August 19, and Friday’s close near 4.70% leaves three business days to cover ten basis points in the wrong direction. Against a year ago the yield is up roughly 46 basis points from 4.24% on August 13, 2025. Until 4.60% breaks, it is a ceiling on how good the mortgage news can get.
Payment Impact for Nashville Buyers
The locked comparison is a $500,000 purchase with 20% down, a $400,000 loan on a 30-year fixed, principal and interest only, excluding taxes, insurance, HOA dues, and closing costs. At this week’s 6.67% the payment is $2,573.16. At last week’s 6.69% it was $2,578.46. The weekly improvement is $5.30 a month, or $1,909 across the full term.
When I am pricing in the $1 million band that dominates Brentwood, Franklin, and Green Hills, the same math looks like this. With 20% down, an $800,000 loan runs $5,146.31 at 6.67% against $5,156.92 at 6.69%, a $10.60 monthly improvement and $3,818 over the term. Against the 6.58% rate of a year ago, that same $800,000 borrower is paying $47.61 more each month today. None of those numbers change a decision on their own. What they do is set the cost of waiting, and at these increments waiting is nearly free, which is exactly why buyers keep doing it.
For the investors I work with, the arithmetic is different, because debt service is underwritten against rental income rather than a household budget. A 2 basis point weekly move is noise in that calculation. What matters is where the rate sits when the loan funds, and at 6.67% the coverage math still requires disciplined acquisition pricing on East Nashville homes and comparable inside-the-loop product.
Strategic Borrower Considerations in Today’s Market
Rates that move 2 to 5 basis points in a week do not change a purchase decision. They change the cost of waiting for one. With the 10-year sitting on a level that has held for nineteen years, that is the calculation I walk buyers through now rather than in September.
What this means by borrower type
- Buyers should treat 6.67% as the working assumption and shop the payment, not the headline. A quarter-point difference in lender pricing is worth roughly ten weeks of this kind of survey movement, so the lender comparison matters more than the timing.
- Sellers should note that purchase and refinance applications have both risen on modest rate relief. Pricing to the current payment band, rather than to spring comparable sales, is what produces offers inside 30 days.
- Investors are underwriting to debt service, not sentiment. With inflation trending toward target, a refinance window later this year is more plausible than it was a month ago, which changes how much rate risk is worth accepting on an acquisition today.
- Move-up buyers carry the hardest math, because they are trading a lower legacy rate for a larger balance. The question is not whether 6.67% is a good rate. It is whether the blended cost of the move clears the value of the house you actually want.
Grant Hammond has 25 years of Nashville real estate experience. He has closed over $1 billion in career sales across Davidson and Williamson Counties. That includes more than 100 luxury transactions above $1.5 million and more than 350 downtown Nashville high-rise condominium transactions. It also covers more than 550 short-term rental transactions, where financing structures such as DSCR and investor financing structures were central to the deal.
Every week someone asks me whether to wait. This week the honest answer is that waiting saved about five dollars a month on a $400,000 loan and told you nothing you did not already know. The borrowers who do best in a range-bound market lock on a payment they have already stress-tested. By contrast, the ones who struggle are still holding out for a number they picked off a headline eighteen months ago.
Nashville Real Estate Market Outlook
The calendar ahead is light on high-impact economic reports, but not on information. We get the minutes from the previous Federal Reserve meeting next week. Those give a more detailed look inside the discussion: what officials were thinking, which risks concerned them, and how they viewed the path forward. Three officials dissented from the decision to hold rates at that meeting, so the minutes carry more weight than usual.
There will also be plenty of Fed speak. With recent jobs reports coming in light and inflation easing, I am listening for whether more officials start backing away from the idea that the next move could be a hike. Beyond that, the next Employment Situation report does not arrive until September 4, 2026, and the next policy decision is September 16, 2026, which carries a Summary of Economic Projections and a refreshed dot plot.
For Nashville that leaves three variables: the 10-year at 4.60%, oil, and the Fed. If the yield reverses Friday’s move and holds beneath 4.60%, the 30-year survey rate works toward the low 6.5% band. In that case the most payment-sensitive segments respond first. Those are entry-level product under $450,000 in Davidson County, and the $750,000 to $1.5 million move-up band across Williamson County. If supply pressure and the Iran risk premium keep the yield at or above 4.70%, the survey rate returns to the 6.70% area and inventory sits longer. For a longer view of how far this has traveled, the July 24 rate update shows the 30-year at 6.58%, which frames the full round trip of the last three weeks.
If you want my read on what this week does to your specific number, that is a fifteen-minute conversation. I would rather have it before you are under contract than after.
Nashville Mortgage Rates FAQ
What are Nashville mortgage rates today?
For the week ending August 14, 2026, the 30-year fixed averaged 6.67% and the 15-year fixed averaged 5.96% per the Freddie Mac Primary Mortgage Market Survey. Daily lender pricing tracked by Mortgage News Daily showed the 30-year index at 6.69% and the FHA 30-year near 6.28%. Your actual quote will differ based on credit score, loan size, property type, occupancy, and lock period.
Did Nashville mortgage rates go up or down this week?
Both fixed terms fell. The 30-year dropped 2 basis points from 6.69% to 6.67%, and the 15-year dropped 5 basis points from 6.01% to 5.96%. On daily lender pricing, Thursday’s cooler wholesale inflation reading drove rates to their lowest levels since July 17. Friday then gave back only a modest amount. As a result, borrowers finished at roughly four-week lows, although rates remain just beneath one-year highs.
What is the mortgage spread and why does it matter in Nashville?
The mortgage spread is the 30-year fixed rate minus the 10-year Treasury yield, which came to 1.97%, or 197 basis points, this week against 2.03% a week earlier. It matters because it is the second lever on your rate. The 10-year actually rose about 4 basis points this week. However, the survey rate still fell 2 basis points, because the spread compressed by 6 as mortgage-backed securities outperformed Treasuries through Friday’s selloff. A spread returning toward its long-run norm would lower Nashville mortgage costs by another 15 to 25 basis points without the Treasury moving at all.
What is the monthly payment on a $500,000 Nashville home right now?
With 20% down and a $400,000 loan on a 30-year fixed at 6.67%, principal and interest run $2,573.16 per month. That excludes property taxes, homeowners insurance, HOA dues, and any mortgage insurance. At last week’s 6.69% the same loan cost $2,578.46, so this week’s move saves $5.30 monthly, or $1,909 across the full 30-year term.
Are FHA rates lower than conventional rates in Nashville?
Yes, on the note rate. Mortgage News Daily showed the FHA 30-year near 6.28% against a 6.69% conventional daily index, a gap of roughly 40 basis points. However, FHA carries an upfront mortgage insurance premium of 1.75% plus an annual premium. As a result, the all-in comparison depends on your down payment and how long you hold the loan. Your lender should run those numbers on your specific file.
Will Nashville mortgage rates fall before the end of 2026?
The level to watch is 4.60% on the 10-year Treasury, a threshold that has held since 2007. The yield closed August 14, 2026 near 4.70%, so that test is not close at the moment. Between now and the September 16, 2026 Federal Reserve decision, the more likely sources of movement are Treasury supply, oil prices, the Iran situation, and the tone of Fed commentary rather than any policy change. Nothing here is a forecast or a rate guarantee, and any lock decision should be made with a licensed mortgage professional on current pricing.
Sources and methodology
Data sources
Rate data reflects weekly averages from the Freddie Mac Primary Mortgage Market Survey for the week ending August 14, 2026, released August 13, 2026. Daily lender pricing comes from the Mortgage News Daily Mortgage Rate Index as of August 13, 2026. Core CPI is the July 2026 reading published by the Bureau of Labor Statistics on August 12, 2026.
The 10-year Treasury yield reflects the August 14, 2026 daily close of approximately 4.70%. That is measured against roughly 4.66% for the week ended August 6, 2026. Both figures are cross-referenced against Federal Reserve Economic Data series DGS10 and the Federal Reserve H.15 constant maturity series. Friday’s move followed a below-expectations retail sales release from the U.S. Census Bureau. However, the bond market discounted that print for Amazon Prime Day timing effects and seasonal distortion in fuel sales, per Mortgage News Daily market commentary.
How the figures are calculated
Spread analysis uses the 30-year PMMS rate minus the 10-year Treasury yield, both expressed in percent. Those are converted to basis points by multiplying by 100. Payment figures use the standard amortization formula for principal and interest only, on a 30-year term with 20% down, excluding taxes, insurance, HOA dues, and closing costs. Finally, year-over-year comparisons reference the same Freddie Mac PMMS week from the prior year.
Sources retrieved August 14, 2026:
- Freddie Mac Primary Mortgage Market Survey. freddiemac.com/pmms
- Freddie Mac PMMS release, “Mortgage Rates Average 6.67%,” August 13, 2026.
- Federal Reserve Economic Data, series DGS10, 10-Year Treasury Constant Maturity Rate. fred.stlouisfed.org/series/DGS10
- Federal Reserve Board H.15 Selected Interest Rates, release dated August 13, 2026. federalreserve.gov/releases/h15
- Mortgage News Daily Mortgage Rate Index, August 13, 2026. mortgagenewsdaily.com/mortgage-rates
- Federal Reserve FOMC meeting calendar. federalreserve.gov/monetarypolicy/fomccalendars.htm
- U.S. Bureau of Labor Statistics, Consumer Price Index, July 2026, released August 12, 2026. bls.gov/cpi
- U.S. Bureau of Labor Statistics, Employment Situation release schedule. bls.gov/schedule/news_release/empsit.htm
Disclosures
About the broker. Grant Hammond is a Tennessee-licensed real estate broker (TN Broker #261980) at Compass RE, leading the BDG Partners team across Davidson and Williamson Counties.
Commission and compensation disclosure. Broker fees are not set by law and are fully negotiable. All commission and buyer-agency details should be discussed before contract.
Mortgage disclosure. Mortgage rates change daily. The rates referenced above are the Freddie Mac PMMS weekly average for the week ending August 14, 2026. Daily lender quotes will differ based on credit profile, loan size, property type, and lock period. Nothing in this analysis constitutes a rate lock guarantee or a commitment to lend. Speak with a licensed mortgage professional for personalized pricing.
Forward-looking statement disclosure. This post contains forward-looking observations about interest rates, Federal Reserve policy, oil prices, and Middle Tennessee housing conditions. Those observations reflect conditions as of August 14, 2026 and are subject to change without notice. They are not predictions, guarantees, or investment advice. Actual outcomes may differ materially.
More Nashville mortgage analysis
- Nashville Mortgage Rates Today, the live weekly tracker.
- Mortgage Rates and Financing archive, every weekly update.
- Nashville Airbnb financing and DSCR loans.
- FHA-approved Nashville condo buildings.