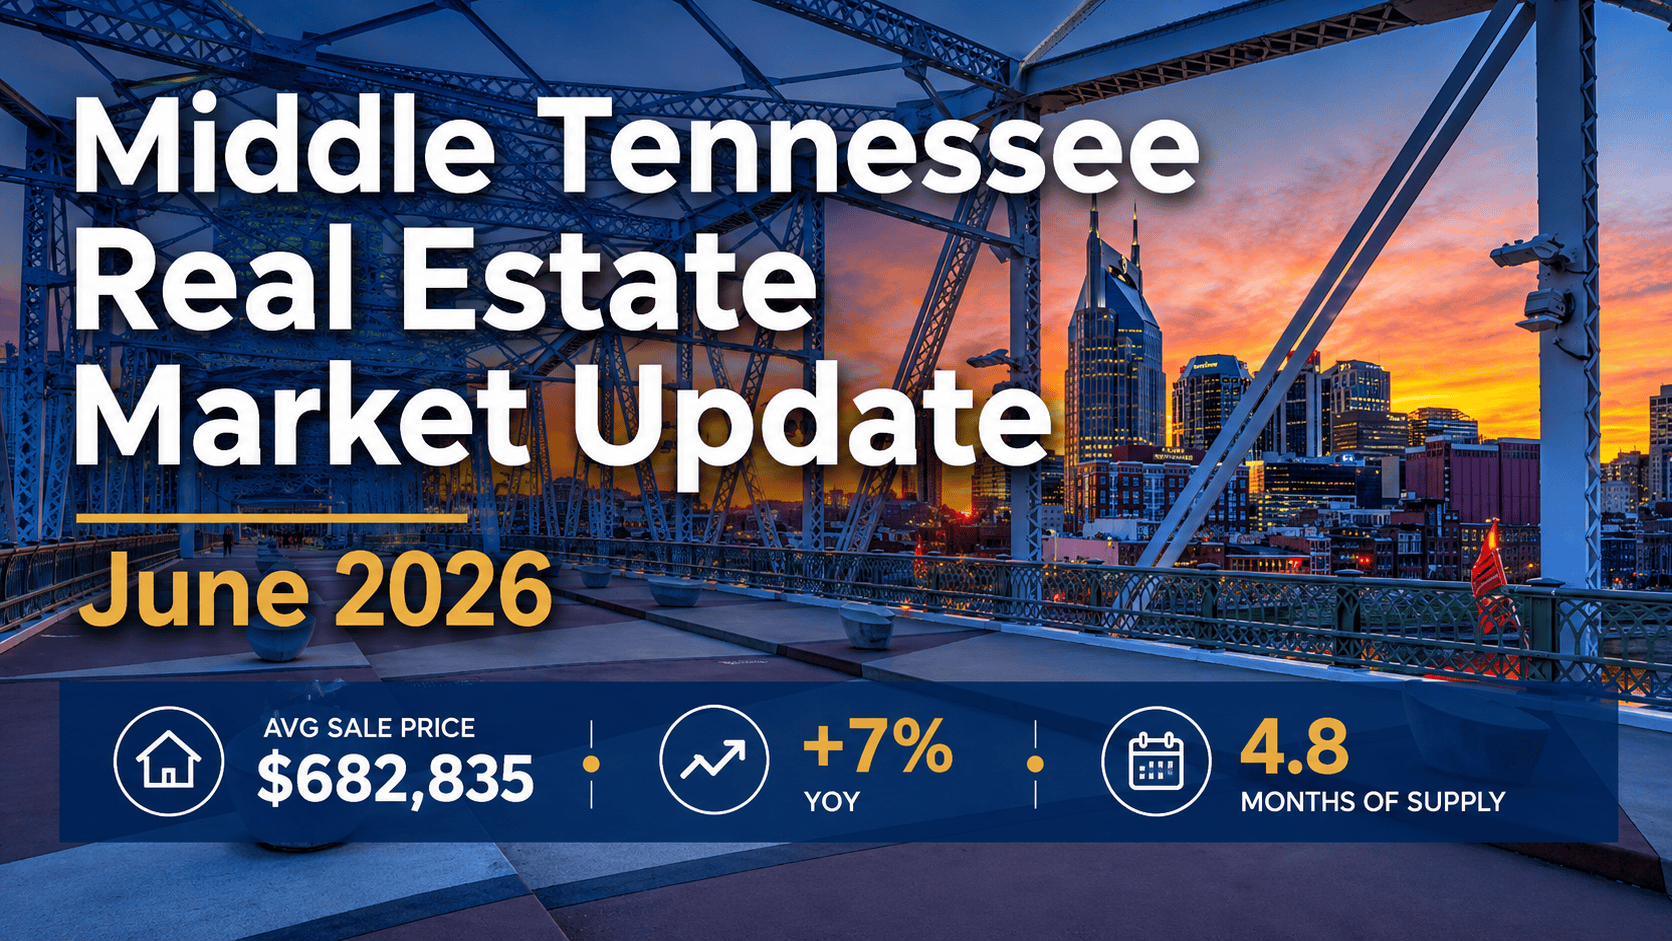
The Nashville housing market and the broader Middle Tennessee real estate market entered June 2026 with inventory up 8% year over year, new contracts up 12%, closings down 4%, and the average sale price up 7% to $682,835.
The June data confirms a market that is not collapsing, but it is no longer moving with the speed of the low-rate era.
Inventory is still building. Buyers are still active. Prices are still rising. However, the transaction process remains slower, more selective, and more dependent on financing conditions.
The defining feature of the June 2026 Nashville and Middle Tennessee housing market is not weakness. It is friction.
Middle Tennessee Housing Market Key Takeaways June 2026
- New listings declined 16% year over year
- New under contract increased 12%, showing active demand
- Active inventory rose 8% across the region
- Closings declined 4%, showing continued transaction friction
- Average sale price rose 7% to $682,835
- Median sale price rose 3% to $474,990
- Months of supply increased 12% to 4.8

Middle Tennessee Real Estate Market Data June 2026
Across Montgomery, Cheatham, Robertson, Davidson, Wilson, Williamson, Maury, Rutherford, Dickson, and Sumner counties:
- New listings: 5,984, down 16%
- New under contract: 3,811, up 12%
- Active inventory: 13,748, up 8%
- Total inventory: 19,857, up 6%
- Closings: 3,467, down 4%
- Average days on market: 33, up 12%
- Months of supply: 4.8, up 12%
| County | New listings | Under contract | Active inventory | Closings | Avg sale price | Median sale price | Avg days on market | Months of supply |
|---|---|---|---|---|---|---|---|---|
| Montgomery County | 652 | 448 | 1,621 | 422 | $362,954 | $330,500 | 40 | 4.71 |
| Cheatham County | 77 | 56 | 248 | 45 | $435,889 | $390,000 | 42 | 6.78 |
| Robertson County | 239 | 141 | 428 | 118 | $412,394 | $368,450 | 31 | 4.5 |
| Davidson County | 1,644 | 1,031 | 4,621 | 969 | $730,085 | $497,399 | 30 | 5.69 |
| Wilson County | 566 | 335 | 990 | 277 | $627,749 | $525,000 | 31 | 4.41 |
| Williamson County | 752 | 507 | 1,710 | 523 | $1,327,957 | $999,000 | 29 | 4.01 |
| Maury County | 412 | 225 | 871 | 204 | $485,596 | $444,995 | 34 | 5.19 |
| Rutherford County | 855 | 587 | 1,621 | 499 | $488,714 | $435,000 | 34 | 3.96 |
| Dickson County | 143 | 103 | 323 | 61 | $404,964 | $384,900 | 38 | 6.41 |
| Sumner County | 644 | 378 | 1,314 | 349 | $580,093 | $496,277 | 31 | 4.5 |
| Middle Tennessee total (10 counties) | 5,984 | 3,811 | 13,748 | 3,467 | $682,835 | $474,990 | 33 | 4.8 |
For readers following this series, the month-over-month trend echoes the year-over-year story. Compared with May 2026, the regional average sale price rose about 5% month over month from $650,362, while months of supply edged up from 4.56 to 4.8. Prices are still firming even as supply slowly builds.
This builds on the May 2026 Middle Tennessee real estate market update, where demand was beginning to work through elevated inventory.
June confirms that pattern, but with more complexity. Contracts are rising, which means buyers are still participating. Yet closings are falling, which means those transactions are taking longer to complete.
That is the central tension in the June market: demand exists, but execution is slower.
Why the Nashville Housing Market Is Behaving This Way
The June 2026 housing data is best understood through financing conditions.
Freddie Mac reported the 30-year fixed mortgage rate at 6.49% and the 15-year fixed rate at 5.84% as of June 25, 2026. A year earlier, the 30-year fixed rate averaged 6.77%, so rates are lower than last year but still far above the sub-3% environment that shaped the last cycle.
The 10-year Treasury yield also remained elevated near the low-to-mid 4% range in late June. That keeps mortgage pricing firm and limits how much payment relief buyers actually feel.
As a result, buyers are not absent. They are constrained.
This explains why contracts can rise while closings fall. Buyers are writing offers, but underwriting, affordability, inspection negotiations, and rate sensitivity continue to slow the path from contract to closing.
The market is not supply-driven. It is financing-driven.
For current financing context, see our guide to Nashville mortgage rates today.
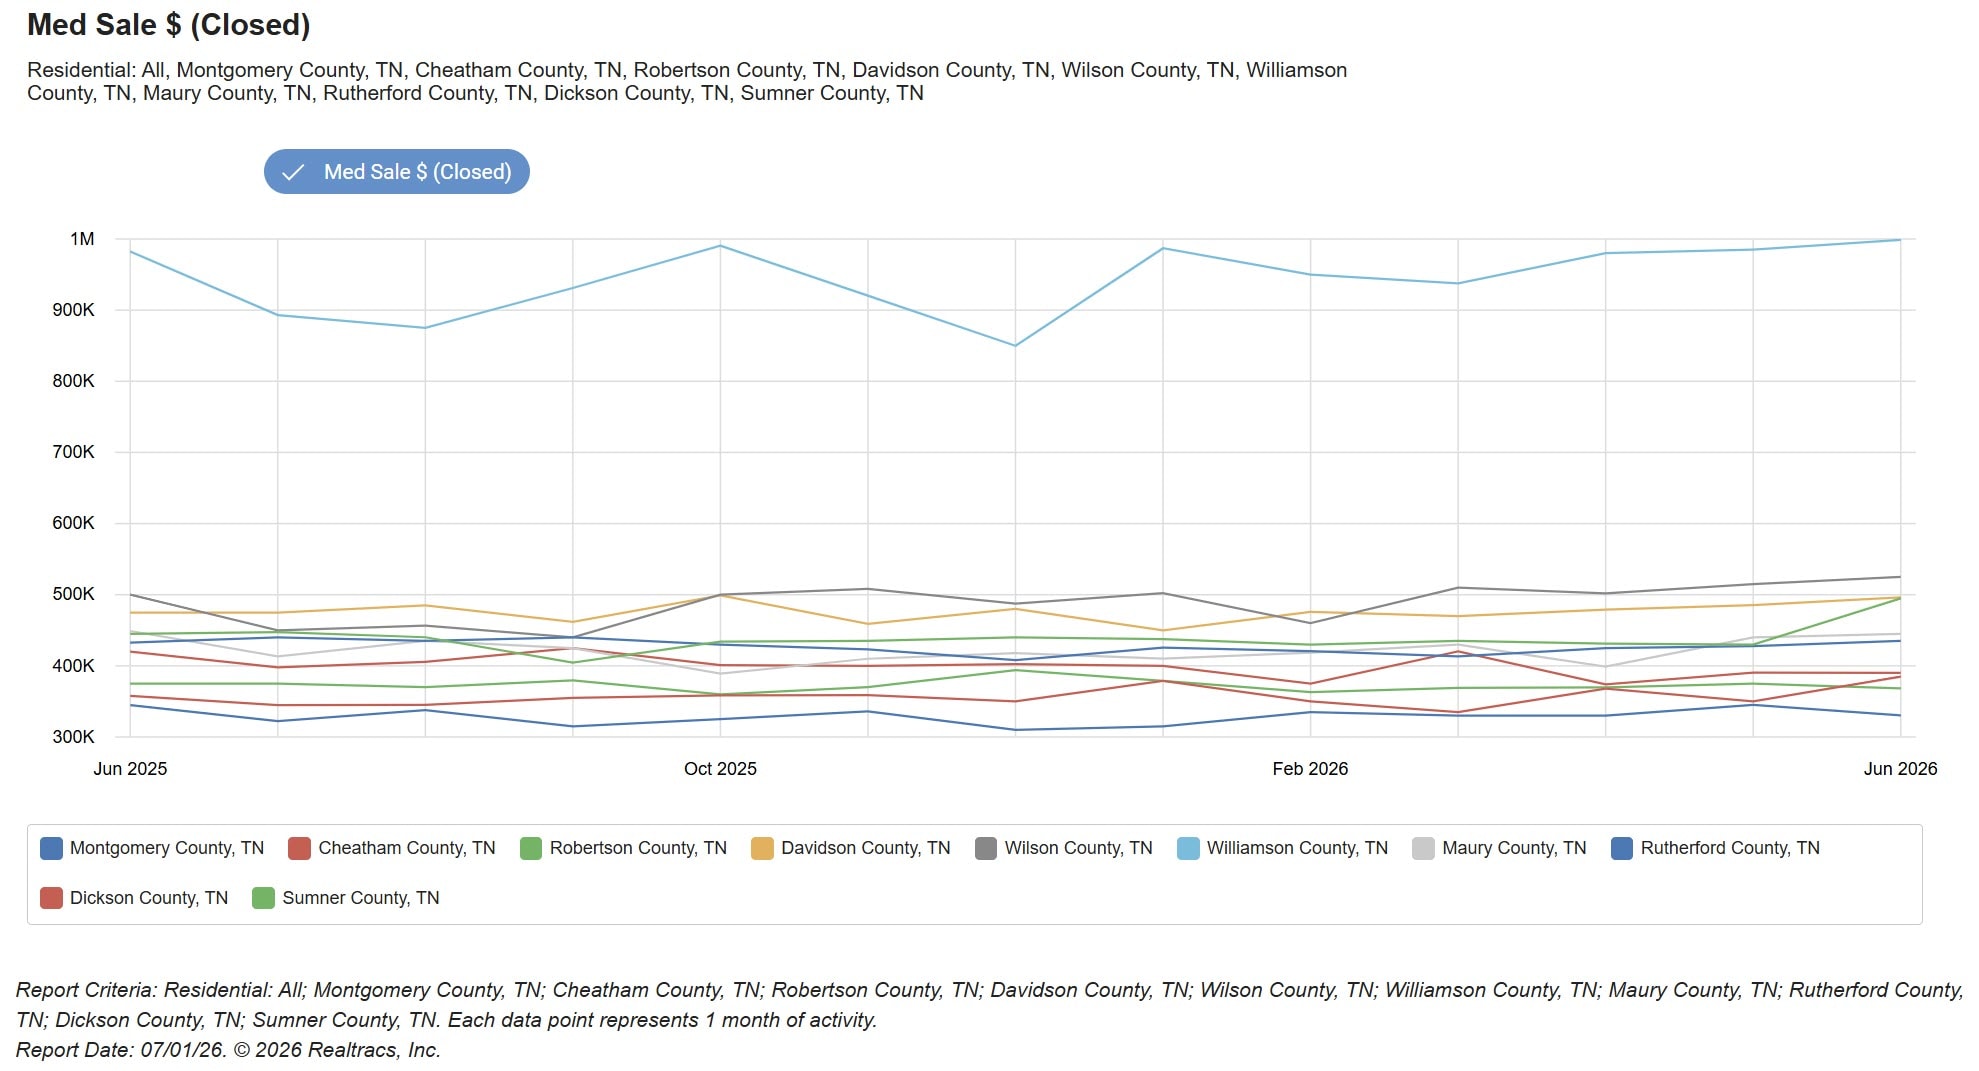
Closed Home Price Trends Over the Last 12 Months in Middle Tennessee
Closed home price trends across Middle Tennessee show continued price resilience.
- Average sale price: $682,835, up 7% year over year
- Median sale price: $474,990, up 3% year over year
The spread between average and median pricing remains important. Average pricing is being pulled higher by strength in higher-end markets, especially Williamson, Davidson, Wilson, and Sumner Counties.
Median pricing is also rising, but at a slower pace. That suggests the broader market is firm, while the upper end is carrying more of the appreciation.
This is not a broad overheating cycle. It is selective price strength in a rate-constrained market.

County-Level Real Estate Trends in Middle Tennessee
Middle Tennessee is no longer behaving as one uniform housing market. County-level differences are becoming more important than the regional average.
Davidson County Real Estate Market June 2026
Average price: $730,085
Median price: $497,399
Months of supply: 5.69
Davidson County is showing higher pricing but slower absorption. That combination points to a market where demand exists, but buyers are selective, a dynamic that is especially visible among downtown Nashville condos, where inventory and pricing have both climbed.
Williamson County Real Estate Market June 2026
Average price: $1,327,957
Median price: $999,000
Months of supply: 4.01
Williamson County remains the strongest high-end market in the region. Supply is tighter than Davidson, and pricing continues to reflect sustained demand at the high end of the market, led by Franklin homes for sale.
Rutherford County Real Estate Market June 2026
Average price: $488,714
Median price: $435,000
Months of supply: 3.96
Rutherford remains one of the tighter markets in Middle Tennessee. Relative affordability continues to support demand and faster absorption.
Wilson County Real Estate Market June 2026
Average price: $627,749
Median price: $525,000
Months of supply: 4.41
Wilson County continues to show strong pricing with relatively balanced supply. It remains one of the clearest examples of suburban demand holding up.
Maury County Real Estate Market June 2026
Average price: $485,596
Median price: $444,995
Months of supply: 5.19
Maury County is more buyer-tilted than the tighter core markets. Higher months of supply gives buyers more room to negotiate.
What Months of Supply Means in the Middle Tennessee Housing Market
Months of supply increased to 4.8 in June 2026, up 12% year over year.
Months of supply measures how long it would take to sell all current inventory at the current pace of sales.
At 4.8 months, Middle Tennessee is not in a distressed market. However, it is no longer in a scarcity-driven seller’s market either.
This is the zone where pricing discipline matters.
Well-positioned homes can still sell quickly. Overpriced homes will sit, especially when buyers are already stretched by mortgage rates.
Nashville Housing Market Forecast: Where Middle Tennessee Is Headed
This Nashville housing market forecast comes down to one variable more than any other: the direction of mortgage rates.
Over the past two years, the Nashville housing market moved from a low-rate, high-velocity market into a higher-rate, slower-moving market.
Earlier in 2026, inventory was rising because absorption had slowed. By June, demand is still present, but the market has become more selective.
The next phase of the Nashville real estate market will depend heavily on mortgage rates.
- If rates stay near the mid-6% range: Expect stable pricing, elevated inventory, and continued buyer selectivity
- If rates fall below 6%: Demand could accelerate quickly, especially in Davidson, Williamson, Rutherford, and Wilson Counties
- If rates rise back toward 7%: Inventory could build further, and buyer leverage would expand
The Nashville and Middle Tennessee housing market in 2026 is not defined by decline or acceleration. It is defined by selectivity. In this type of market, positioning matters more than timing.
For deeper context and the long-run trend, see our ongoing Nashville housing market analysis.
What This Means for Buyers, Sellers, and Investors
Here is how the current Nashville real estate market translates into strategy for each type of participant.
Buyers: You have more leverage than you had during the low-inventory years. However, the best homes are not sitting indefinitely. Focus on payment, condition, and seller motivation.
Sellers: Pricing accuracy matters more than momentum. The market will reward homes that are priced correctly and will not reward homes that are chasing last cycle’s expectations.
Investors: This is a selective market, not a distressed one. Focus on durable demand, realistic rent assumptions, and longer hold periods, a discipline that applies equally to long-term rentals and Nashville Airbnb investment properties.
After more than two decades in the Middle Tennessee real estate market, spanning luxury homes, downtown high-rise condos, and short-term-rental investment properties, one pattern remains consistent. The best opportunities usually appear when the market is misunderstood, not when it is obvious.
Nashville and Middle Tennessee Real Estate Market FAQ
What is happening in the Nashville housing market in 2026?
As of June 2026, the Nashville housing market is active but slower and more selective. New contracts rose 12% year over year while closings fell 4%, average sale price rose 7% to $682,835, and months of supply increased to 4.8. Demand is present, but higher mortgage rates are adding friction to the path from contract to closing. That friction is the defining feature of the Nashville real estate market heading into the second half of 2026.
Is the Nashville and Middle Tennessee housing market slowing down in 2026?
The market is slower than the low-rate period, but demand has not disappeared. Contracts increased 12% year over year in June, while closings declined 4%.
Are home prices dropping in Nashville and Middle Tennessee?
No. Average sale price rose 7% year over year to $682,835, and median sale price rose 3% to $474,990.
Is it a buyer’s market in Middle Tennessee right now?
The market is tilted toward buyers in some segments because inventory is higher and homes are taking longer to sell. However, strong properties in high-demand locations still attract competition.
Why is inventory rising if new listings are down?
Inventory is rising because homes are moving more slowly through the transaction process. New listings declined 16% year over year, but active inventory still rose 8%.
What happens to the Nashville housing market if mortgage rates fall?
If mortgage rates fall meaningfully, buyer demand could accelerate quickly. That would likely reduce inventory and increase competition for well-priced homes.
Which Middle Tennessee counties are strongest right now?
Williamson, Rutherford, Wilson, and parts of Davidson County show stronger demand conditions. Maury, Cheatham, and Dickson have higher months of supply and more buyer leverage.