
Get a Property-Specific Pro Forma →
Send me an address and I will pull verified comparables, model the NOI, and produce a pro forma that runs cash-on-cash, IRR, and break-even sensitivity. No obligation.
Nashville Airbnb investment properties produce returns through three measurable levers: gross revenue (the topline a property generates over a 12-month rental cycle), operating expense ratios (typically 30 to 38 percent for managed Davidson County investment properties), and the unit-economics math that converts revenue minus expenses minus debt service into cash-on-cash return. This guide walks investors through the full pro forma calculation for a Nashville Airbnb investment property, using verified Multiple Listing Service data and expense benchmarks from more than 550 closed short-term rental transactions across Davidson County.
This Nashville Airbnb ROI guide walks the income approach for valuing a Nashville short-term rental investment. Every revenue benchmark and every cap rate range traces to verified MLS data from the past three years. Expense ratios reflect typical Nashville STR operations and should be modeled against your specific property and financing.
Methodology
Revenue data: Realtracs MLS NOOSTR transactions within a 5-mile radius of Lower Broadway, May 2023 through May 2026. 638 closed sales analyzed across 267 unique subdivisions. Median sale prices, days on market, and $ per square foot by building are pulled directly from the closed-sale records, and cross-referenced against active inventory.
Expense ratios reflect typical Nashville STR operating patterns observed across 550+ closed STR transactions and are presented as ranges. Specific operating economics vary by building, management structure, financing path, and tax setup. This page is general framework only. Always work with your CPA and STR-experienced agent for property-specific modeling.
For the underlying regulatory framework see our Nashville STR Zoning and Permits Guide. For the buyer’s process see How to Buy a Nashville Airbnb. For specific building intel see Best Nashville Airbnb Investment Buildings.
How does the income approach value a Nashville Airbnb investment property?
A NOOSTR investment value is the net operating income divided by the market cap rate. Three numbers and a discount rate. The discipline is getting each input right.
For a Nashville NOOSTR pulling $90,000 in annual NOI at a 6.5% market cap rate, the income approach valuation is $1,384,615. At a 7.5% cap rate the same NOI prices at $1,200,000. The 100 basis-point cap rate change is the difference between a competitive offer and walking. The cap rate is therefore the single most important number to get right, and the one most often guessed at by less-experienced buyers.
What are the 4 steps to value a Nashville Airbnb investment property?
Disciplined investor underwriting follows the same four steps every time. Skip any step and the NOI estimate is off, the cap rate is misapplied, or the deal walks itself.
Step 1: Estimate Gross Revenue
Three sources for the gross revenue estimate, in order of reliability:
- Trailing 12 to 24 months of actual rental history if the property has been operating as Airbnb. Pulled from Airbnb, peer marketplaces, and direct-booking platform statements, reconciled against bank deposits.
- third-party STR analytics platforms neighborhood comparables if the property is pre-construction or has not operated yet. third-party STR analytics platforms aggregates platform booking data and produces neighborhood-level ADR (average daily rate) and occupancy estimates.
- Building-level comparable analysis. Same-building units with operating history often produce the cleanest projection for a new buyer in that building.
The formula: Gross Revenue = ADR × Nights Booked. Or equivalently: ADR × (365 × Occupancy Rate). Nashville STRs typically run 55-75% occupancy depending on building, season, and pricing strategy. ADR ranges $200-$600 depending on bedroom count, building amenity, and neighborhood.
Step 2: Subtract Operating Expenses to Get NOI
Operating expenses are everything required to operate the property except mortgage debt service. The line items:
- Cleaning (per-turn, charged to guests but reduces effective revenue; or modeled as net expense)
- Supplies and consumables (paper, soap, linens, replacement small items)
- Dynamic pricing software (PriceLabs, Wheelhouse , typically $20-40/mo per property)
- Property management (if used; typically 18-25% of gross revenue for full-service Nashville STR PMs)
- Utilities (electricity, water, gas, internet)
- HOA fees (highly variable; can be $200-1,200/mo on condo or townhome properties)
- Insurance (STR-specific liability and property coverage; typically $150-400/mo)
- Property taxes (Davidson County rates apply; verify on the assessor record)
- Repairs and maintenance reserve (model 5-10% of gross revenue)
- Permit and tax registration fees (annual)
- Platform fees (Airbnb host fee, peer marketplaces fees; typically 3-5% of gross)
- Occupancy tax remittance (collected from guest, passes through, but tracked)
NOI = Gross Revenue minus all the above. Net of debt service. Most well-located Nashville NOOSTRs convert 35-55% of gross to NOI depending on management structure.
Step 3: Apply a Market Cap Rate
Cap rate is the return an investor would accept on a comparable property, expressed as NOI/value. The Nashville NOOSTR cap rate varies by:
- Zoning certainty. Properties in the 29 NOOSTR-eligible districts (or SP/PUD-approved parcels) trade at tighter cap rates than legacy residential-zone NOOSTRs whose permits die at sale.
- Operating history. Buildings with multi-year documented operating data trade at tighter cap rates than pre-construction or thin-history buildings.
- Interest rate environment. Cap rates broadly move with the 10-year Treasury and DSCR loan rates. As financing cost rises, cap rates widen and valuations compress.
- Building condition and amenity. Rooftop, pool, fitness, and parking add cap-rate compression.
For 2026 transactions in the 5-mile-from-Broadway radius, observed effective cap rates on closed NOOSTR sales fall in the 5.5% to 8.0% band depending on the above factors. We will model the specific cap rate that applies to a given property when we run a pro forma together.
Step 4 (Nashville Airbnb ROI): Layer in Financing for Cash-on-Cash and IRR
The income approach gives you the property value. To evaluate the deal as an investor, layer in your financing structure:
- Cash-on-Cash Return = (NOI minus annual debt service) divided by total cash invested. Tells you the annual cash yield on the dollars you actually wrote a check for.
- IRR (Internal Rate of Return) = the discount rate that makes the NPV of all cash flows equal to zero over your hold period. Accounts for appreciation, refinances, and exit sale.
- Total Return = (cash flow over hold + sale proceeds at exit minus debt) divided by initial equity, annualized.
For most Nashville STR buyers, cash-on-cash is the operational test (does this thing pay me each year?) and IRR is the strategic test (is this a good use of my capital over the hold period?).
Want a Pro Forma on a Specific Property?
Send me an address. I will pull rental comparables for the building, model NOI with realistic Nashville expense ratios, and produce a side-by-side at multiple cap rate scenarios. Standard turnaround is 24-48 hours.
What revenue benchmarks should Nashville Airbnb investors expect by neighborhood?
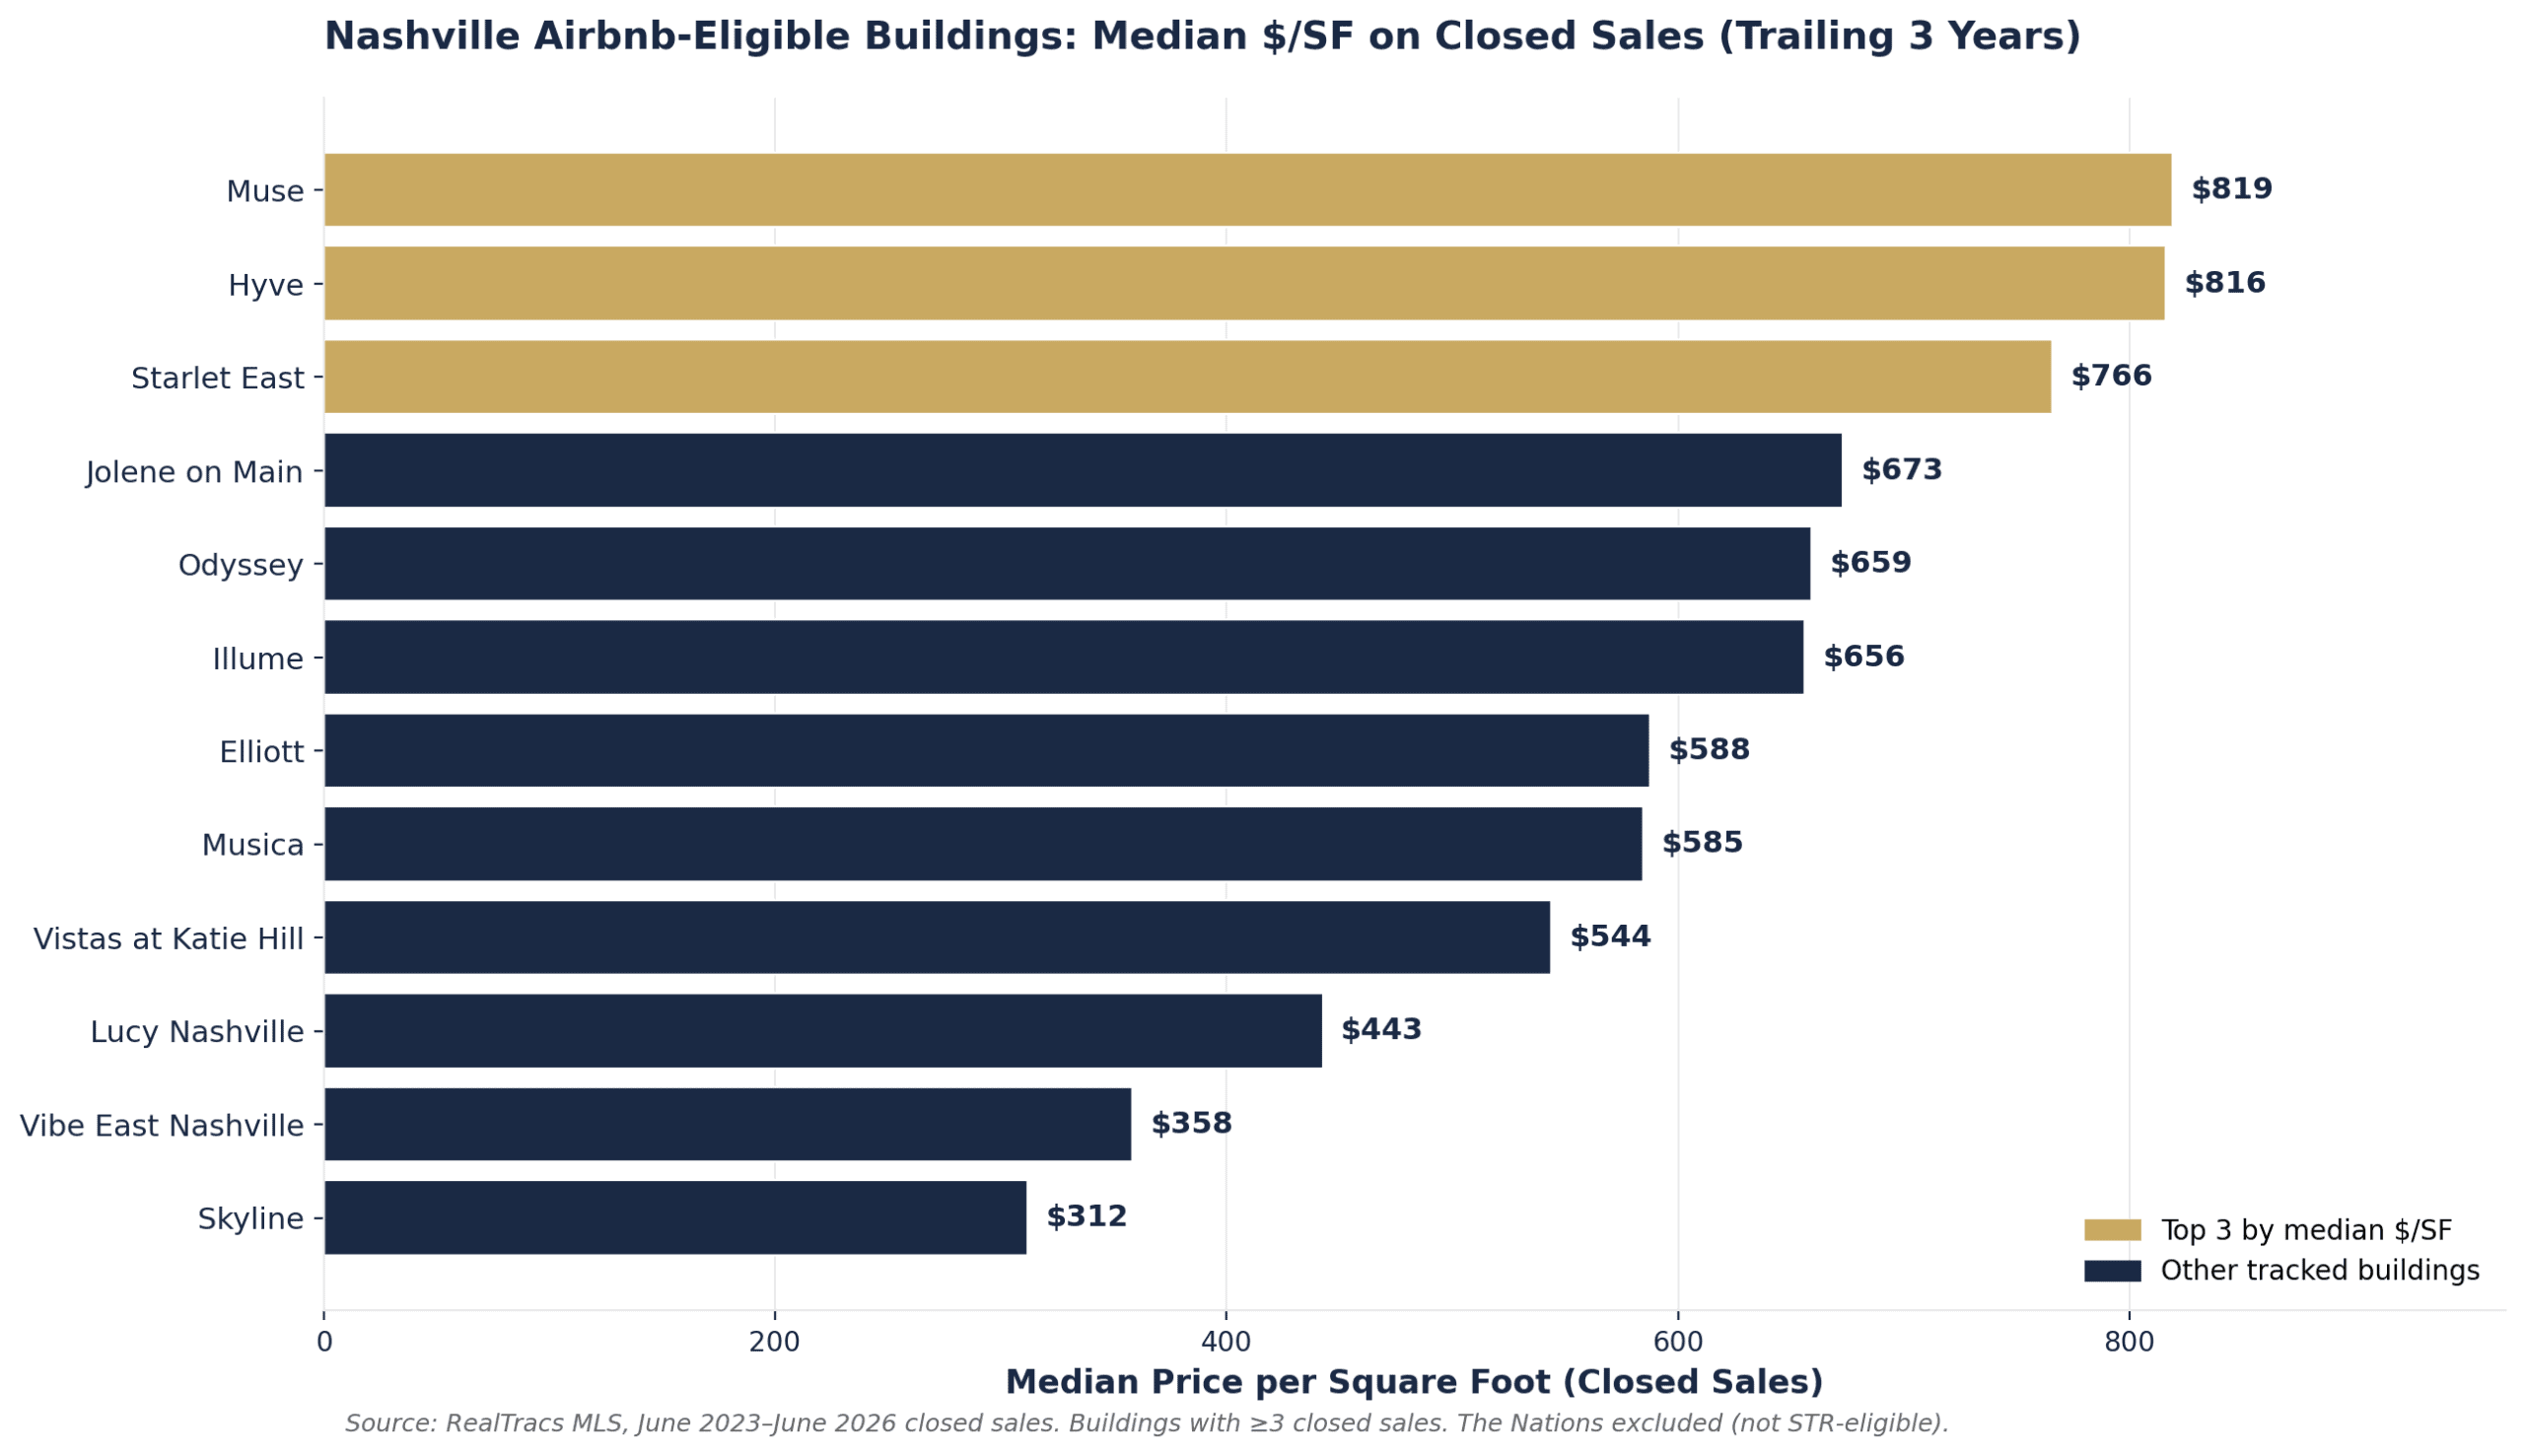
For the underlying transaction-level evidence behind these neighborhood benchmarks, see my three-year MLS analysis of closed Airbnb sales across 31 tracked Nashville buildings. The East Nashville $34.4M dollar volume figure, the $819 Muse price-per-foot ceiling, and the trailing close counts that anchor every assumption here come from that dataset.
Verified from 638 closed NOOSTR sales over the past three years. Use these as the comparable-sales floor in your underwriting. Income approach valuations should exceed these only when the specific property’s NOI justifies the premium.
| Neighborhood | Building Count | Median Sale Range | $/SqFt Range | Typical Year Built |
|---|---|---|---|---|
| Midtown / Music Row (37203, 37212) | 6 | $398K – $1,275K | $588 – $1,140 | 2019-2026 |
| Downtown / SoBro (37201, 37210) | 4 | $450K – $780K | $633 – $847 | 1986-2024 |
| North Nashville / Salemtown (37207) | 7 | $450K – $1,317K | $412 – $766 | 2019-2025 |
| West Nashville / Sylvan Park (37209) | 2 clusters | $283K – $410K | $446 – $509 | 2020-2024 |
| East Nashville / Inglewood (37206, 37216) | 2 | $575K – $623K | $363 – $702 | 2019-2022 |
See which Nashville neighborhoods rank best for new STR investment. For per-building median sale, $/sqft, days on market, and active inventory, see Best Nashville Airbnb Investment Buildings.

What does a Nashville Airbnb pro forma actually look like?
This example uses a hypothetical 3-bedroom, 2.5-bath townhome in the 37207 corridor at the median sale price of comparable verified transactions ($800,000). Inputs reflect mid-range assumptions; your specific property will model differently.
| Line Item | Annual | % of Gross |
|---|---|---|
| GROSS REVENUE | ||
| ADR $325 × 365 nights × 65% occupancy | $77,106 | 100% |
| OPERATING EXPENSES | ||
| Cleaning (net of guest reimbursement) | $3,500 | 4.5% |
| Supplies and consumables | $2,200 | 2.9% |
| Dynamic pricing software | $420 | 0.5% |
| Property management (20% of gross) | $15,421 | 20.0% |
| Utilities | $3,600 | 4.7% |
| HOA fees | $3,600 | 4.7% |
| Insurance (STR-specific) | $3,000 | 3.9% |
| Property taxes | $5,400 | 7.0% |
| Repairs and maintenance reserve (7%) | $5,397 | 7.0% |
| Platform fees (3%) | $2,313 | 3.0% |
| Permit and tax registration | $300 | 0.4% |
| TOTAL OPERATING EXPENSES | $45,151 | 58.6% |
| NET OPERATING INCOME (NOI) | $31,955 | 41.4% |
At a $800,000 purchase price, this property’s unlevered cap rate is $31,955 / $800,000 = 3.99%. That looks tight for a typical investor target. Two real-world adjustments dramatically improve the picture:
- Self-management instead of full-service PM. Removing the $15,421 management fee adds $15,421 to NOI, lifting cap rate to 5.92%. Most local operators or hybrid owner-users self-manage.
- Higher occupancy or ADR pricing strategy. Stretching occupancy to 75% (instead of 65%) lifts gross revenue to $88,969 and after the same expense ratios, lifts NOI to roughly $36,800. Cap rate improves to 4.6% with full-service PM, 6.5% self-managed.
The pro forma exists to show the cap rate sensitivity, not to give a target return. The right way to underwrite a specific property is with verified building-level comparables and an honest expense model. Request a property-specific pro forma below and I will pull the comps for the address you provide.
How do you convert NOI to cash-on-cash return on a Nashville Airbnb investment property?
NOI tells you what the property earns. Cash-on-cash tells you what you earn on the money you actually put in. The difference is debt service.
Using the same sample property ($800K purchase, $31,955 NOI self-managed):
| Scenario | Down Payment | Loan | Annual P&I (est) | Cash Flow | Cash-on-Cash |
|---|---|---|---|---|---|
| All-cash purchase | $800,000 | $0 | $0 | $47,376 | 5.92% |
| 25% down DSCR at 8.0% | $200,000 | $600,000 | ~$52,800 | ($5,424) | negative |
| 25% down DSCR at 7.0% | $200,000 | $600,000 | ~$47,900 | ($524) | break-even |
| 35% down DSCR at 7.0% | $280,000 | $520,000 | ~$41,500 | $5,876 | 2.10% |
| Conforming primary residence at 6.5% (OOSTR) | $80,000 | $720,000 | ~$54,600 | ($7,224) | negative on operating, positive on appreciation |
P&I figures are illustrative; actual rates vary by lender, credit profile, property type, and timing. Engage your lender for current quotes.
Three takeaways from this table:
- Cap rate compression at high financing cost. When DSCR rates are at 8%, the leveraged returns on a 4-5% cap-rate property are negative. This is why 2024-2026 has seen heavy investor preference for higher-cap-rate buildings.
- More down payment improves cash flow but lowers IRR. 35% down covers debt service but ties up more capital. The investor decision is rate-of-return on the marginal $80K (in this example).
- OOSTR economics are not investor economics. The owner-occupant in scenario 4 has negative operating cash flow but is also paying down a mortgage on their primary residence, building equity, and avoiding rent on a different unit. The math is different but the strategy can still be sound.
What could go wrong with a Nashville Airbnb investment property pro forma?
Disciplined underwriting tests the deal at downside scenarios, not just the base case. Three to model on every Nashville STR purchase:
- Occupancy drops 10 percentage points. If your base case assumes 65% occupancy and actual occupancy comes in at 55%, gross revenue drops about 15%. On the sample property, that takes gross from $77K to $65K, and NOI drops by roughly $9K to $11K (since variable costs scale with revenue but most fixed costs don’t). Run this scenario to confirm you can still cover debt service.
- ADR drops 15%. Recession, oversupply, regulatory pressure on tourism. Same revenue impact pattern: gross revenue drops 15%, NOI compresses faster (down 25-30%). If this scenario produces negative cash flow at your financing structure, the property is over-levered.
- Operating expenses rise 20%. Insurance premiums, property tax reassessment, HOA increase, vendor price inflation. Test what happens when total operating expenses jump from $45K to $54K on the sample. NOI drops from $32K to $23K, cap rate compresses to 2.9%. Will you still want to hold this property?
What common ROI mistakes distort Nashville Airbnb investment returns?
The recurring underwriting errors we see on Nashville STR investments:
- Using gross revenue instead of NOI for the cap rate. Cap rate is NOI / value, not gross revenue / value. Confusing the two inflates the apparent return by 50-60%.
- Ignoring HOA fees because the seller does not mention them. Some Nashville townhome developments have $400-1,200 monthly HOAs that significantly impact NOI. Always verify the HOA fee before underwriting.
- Modeling 80%+ occupancy. Sustainable Nashville STR occupancy clusters in the 55-75% band. Anything above 75% is either an exceptional building, an event-week spike, or a forecast that does not hold.
- Skipping the property management line item even when you plan to self-manage. If you might step away from self-managing in year 2 or 3, you need to model what the property looks like with a PM in place. Otherwise an exit valuation falls apart.
- Confusing depreciation tax shield with cash flow. Depreciation reduces taxable income but does not produce cash. Cash-on-cash should be calculated on actual cash flow, with depreciation modeled separately as a tax benefit.
- Underestimating capex reserves. Furniture replacement, appliance replacement, HVAC, roof, deck refresh. 5-10% of gross revenue is the right reserve level for a turnkey property; less invites a painful capex surprise in years 3-5.
Run the Numbers on Your Target Property
I will produce a building-specific NOI model, layer in realistic Nashville expense ratios, run multiple cap rate scenarios, and test the downside cases. Standard turnaround 24-48 hours.
Nashville Airbnb Revenue & ROI FAQs
What is an Airbnb pro forma?
A Nashville Airbnb pro forma is a property-specific cash-flow model that projects annual gross rental revenue, operating expenses, debt service, and net operating income for a short-term rental investment. The income approach below builds one step by step using verified MLS comps from 31 Airbnb-eligible Nashville buildings, current Tennessee tax rates, and expense ratios from 550-plus closed Nashville STR transactions since 2018.
What ROI should I expect on a Nashville Airbnb?
For 2026 transactions in the 5-mile-from-Broadway corridor, observed effective cap rates on closed NOOSTR sales fall in the 5.5% to 8.0% band depending on zoning certainty, operating history, and financing environment. Cash-on-cash returns vary further based on financing structure: all-cash and lightly-leveraged deals can produce 5-7% cash-on-cash, while highly-leveraged purchases at current DSCR rates often produce break-even or negative cash flow with returns coming from appreciation and principal paydown.
What is a good cap rate for a Nashville short-term rental?
There is no universal “good” cap rate. Cap rates vary by zoning certainty, operating history, and the prevailing interest rate environment. As of 2026, Nashville NOOSTR properties in the 29 zoning districts with documented operating history typically trade between 5.5% and 7.0% cap. Legacy residential-zone NOOSTRs (whose permits die at sale) often trade closer to residential comparables at 8%+ effective cap because the buyer is not paying for continuing STR income.
What is the average ADR for a Nashville Airbnb?
ADR varies dramatically by bedroom count, building amenity, and neighborhood. The typical Nashville STR clusters $200-$600 per night. Lower Broadway-walkable properties pull higher ADR than properties requiring rideshare. Larger units (3+ bedrooms) command higher absolute ADR but often similar per-bedroom yield. third-party STR analytics platforms provides neighborhood-level ADR data.
What is the typical occupancy rate for a Nashville Airbnb?
Sustainable Nashville STR occupancy clusters in the 55-75% band. Top-tier operators with strong reviews, dynamic pricing, and prime locations can push 75%+. Newer or weaker-positioned properties may run 45-55% in the ramp-up period. Modeling above 75% is risky for buyer underwriting.
How much do operating expenses typically eat into Nashville STR gross revenue?
Most full-service-managed Nashville STRs convert 35-45% of gross to NOI. Self-managed properties convert 55-65%. The biggest single line item is property management at 18-25% of gross. The next-largest combined block is HOA + property taxes + insurance, which together can run 10-20% of gross.
Can I self-manage a Nashville Airbnb from out of state?
Possible but harder than local self-management. Nashville STRs require a local responsible party that can answer guest issues 24/7 during the rental period (Metro Code requirement). Most out-of-state owners use either a full-service property manager or a co-host arrangement with a local Nashville operator. Pure self-management works best for owner-occupant or local-operator pathways.
What is cash-on-cash return and how does it differ from cap rate?
Cap rate is unlevered: NOI divided by property value. Cash-on-cash is levered: (NOI minus debt service) divided by total cash invested (down payment plus closing costs plus initial improvements). Cap rate measures property quality; cash-on-cash measures investor return at your specific financing.
Should I use DSCR financing or all-cash for a Nashville Airbnb?
Depends on your capital allocation strategy and target IRR. DSCR amplifies returns when cap rates exceed financing cost (positive leverage) and compresses returns when they do not (negative leverage). At current rates (2026), DSCR makes most sense on higher-cap-rate properties and self-managed structures. All-cash makes most sense for buyers prioritizing cash flow stability and operational flexibility.
What if Nashville STR rules change and my property cannot operate?
This is the regulatory risk priced into Nashville STR cap rates. The 29-district NOOSTR zoning has been stable since 2018. Legacy NOOSTRs in residential zones already face permit-death-at-sale risk per BL2020-187. Future rule changes are possible but the established framework has held through multiple Council cycles. Investors typically build a 50-100 basis point regulatory risk premium into cap rates. See our Zoning and Permits Guide for the full regulatory framework.
How do tax considerations affect my return?
Significantly. Depreciation reduces taxable income (not cash flow). Cost segregation studies can accelerate depreciation in the early hold years. 1031 exchanges defer capital gains at sale. Section 121 primary residence exclusion can apply for OOSTR. These tax effects can swing after-tax IRR by 200-400 basis points. Always model with your CPA. See our Nashville STR Tax Guide for the complete framework on federal, state, and Metro tax obligations.
Can you produce a pro forma for a specific property I am considering?
Yes. Send me the address and your target hold period. I will pull building-level comparables, model NOI with realistic Nashville expense ratios, run multiple cap rate scenarios, and stress-test the downside. Standard turnaround 24-48 hours.
Ready to run a property-specific Nashville Airbnb investment pro forma?
I have closed 550+ Nashville STR transactions and have building-level data on every featured Nashville Airbnb investment building. Send me an address, your target hold period, and how you plan to finance the purchase. I will send back a complete pro forma with NOI model, cap rate analysis, cash-on-cash projection, and downside sensitivity. No obligation.
Broker fees are not set by law and are fully negotiable. We will discuss representation and compensation when we talk.
Sources and methodology for Nashville Airbnb investment property analysis
Investment property revenue and expense benchmarks in this guide are derived from primary data layers: Nashville Multiple Listing Service (Realtracs) closed Airbnb-eligible transactions across 31 tracked NOOSTR-eligible buildings, Metro Nashville Codes and Building Safety NOOSTR permit framework, Metro Nashville Office of the Trustee Davidson County property tax rates, Tennessee Department of Revenue state lodging tax framework, Federal Reserve and Mortgage Bankers Association weekly rate surveys, IRS Publication 925 passive activity rules, and 550-plus closed short-term rental transactions through BDG Partners at Compass RE since 2014.
- Metro Nashville Codes and Building Safety
- Metro Nashville Office of the Trustee
- Tennessee Department of Revenue
- IRS Publication 925
About Grant Hammond
Grant Hammond is a Nashville-based real estate broker affiliated with Compass RE through BDG Partners. He has closed more than 550 short-term rental transactions, more than 350 high-rise condo sales, and hundreds of millions in luxury closings across Middle Tennessee. His specializations include short-term rental investment, downtown high-rise condos, luxury, and new construction. Press citations include The Tennessean, Nashville Business Journal, Inman, and HousingWire. He is a Nashville Emerging Leaders Award (NELA) recipient and a multi-year Diamond Elite producer. Read Grant’s full bio at /about/. Wikidata entity: Q140006180.
Brokerage compliance note: Broker fees are not set by law and are fully negotiable.
