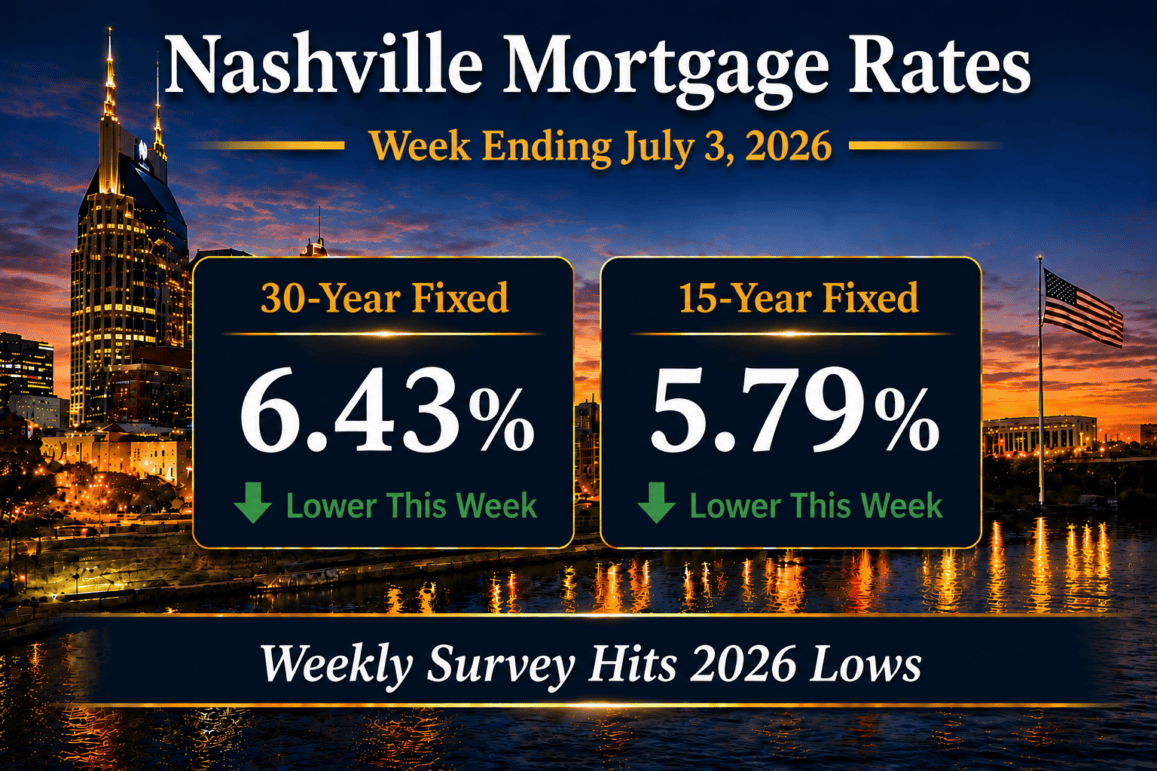
Nashville mortgage rates fell on the weekly survey, with the 30-year fixed averaging 6.43% and the 15-year fixed averaging 5.79% for the week ending July 3, 2026, according to Freddie Mac PMMS. Those are the lowest weekly averages of 2026, though the survey and the day-to-day lender pricing told two different stories this week.
As James Brown put it, “Living in America.” This Fourth of July is the country’s 250th. It is a fitting moment to note that progress rarely runs in a straight line, and this week’s rates proved the point. The weekly survey printed new lows for the year. Effective daily pricing, however, rose about an eighth of a point by midweek before recovering. The culprit was not a big economic surprise. It was quarter-end volatility, the same settlement crush that hit bonds late last week. Rates are built on bonds. So when a huge amount of money changes hands in a compressed window at quarter-end, the tape can jump for no clear reason. That is what happened Tuesday and Wednesday.
I publish this read every Friday for one reason. The gap between the daily headline rate and what actually clears at the closing table matters for Middle Tennessee buyers. For the live weekly snapshot, see our Nashville mortgage rate tracker. This post is the broker read on what moved and what it means locally.
In this report
Market Summary
- Nashville 30-year fixed mortgage rate averaged 6.43%, down from 6.49% the prior week (down 6 basis points).
- Nashville 15-year fixed mortgage rate averaged 5.79%, down from 5.84% the prior week (down 5 basis points).
- FHA 30-year mortgage rates were near 6.17%.
- The 10-year Treasury yield ended near 4.46%, up from about 4.39% the prior week.
- Mortgage spreads were near 1.98%, or 198 basis points, down about 7 basis points on the week.
- Effective daily lender pricing on the 30-year rose about 7 basis points on the week, diverging from the survey after a quarter-end volatility spike.
- Federal Reserve policy remained restrictive, with the federal funds rate held at 3.50% to 3.75% at the June 16 to 17 meeting.
- Year over year, the 30-year is down about 24 basis points (from 6.67%) and the 15-year is down about 10 basis points.
The weekly averages above come from the Freddie Mac PMMS release for the week ending July 3, 2026. Daily lender pricing context references the Mortgage News Daily rate index.
Mortgage Rate Dashboard
The mortgage rate dashboard shows a 6.43% 30-year fixed rate, a 5.79% 15-year fixed rate, an FHA 30-year rate near 6.17%, a 10-year Treasury yield near 4.46%, and a mortgage spread near 1.98% (198 bps).
Nashville Mortgage Rates This Week
Nashville mortgage rates cut two ways this week. Which number you trust depends on how you measure. The Freddie Mac survey landed at 6.43% on the 30-year and 5.79% on the 15-year. Both fell, down 6 and 5 basis points from the prior week, to the lowest weekly averages of 2026 so far. On effective daily lender pricing, though, the 30-year finished about 7 basis points higher. Both are true at once, and the reason is timing.
Rates jumped early in the week on quarter-end volatility. By Wednesday the average 30-year sat about an eighth of a point higher, as some lenders caught up to a late move from Tuesday. Then June’s jobs report landed Thursday at 57,000 new jobs, well short of the 110,000 expected. Soft labor data is usually good for rates. As a result, bonds improved and mortgage pricing recovered nearly half of the spike into the holiday weekend. The weekly survey still shows lower rates, mainly because it has not fully captured Wednesday’s move. Freddie Mac also dilutes that day by averaging it with the four prior business days.
For the buyers I work with across Davidson and Williamson Counties, the practical read is simple. The survey lows overstate how much borrowing conditions actually improved. Still, the context is encouraging. Even after this week’s bounce, rates sit below where they were in early June and mid-May. When I advise a client mid-purchase, that is the framing I use. I weigh current pricing against the recent range, not against a single week’s survey headline.
Institutional Macro Snapshot
What Is Driving Mortgage Rates Right Now?
Three forces set the tape this week: quarter-end volatility, a soft June jobs report, and a Fed the market increasingly thinks could hike again this year. It was a noisier week than the calm run I described in last week’s Nashville mortgage rate update. Most of the noise, though, came from trading mechanics rather than fundamentals.
1. Quarter-end volatility drove the midweek spike
The bond market saw another dose of end-of-quarter drama this week. It was the same settlement crush that produced a surprise spike late last week. A huge amount of money changes hands in a compressed window at quarter-end. Because of that, there is no clean way to measure why the tape moves as it does. Tuesday’s rates jumped for no apparent reason. Wednesday then added an aftershock as some lenders caught up to Tuesday’s late move. That took the average 30-year about an eighth of a point higher by midweek. For Nashville borrowers, the lesson is that not every rate move reflects the economy. Some of it is just the calendar, and calendar-driven moves tend to fade.
2. A weak jobs report pulled rates back down
June’s Employment Situation, released Thursday, July 2, showed 57,000 new jobs against a median forecast of 110,000. Weak labor data is generally good for rates, because it eases the pressure that keeps the Fed restrictive. As a result, bonds improved on the report and mortgage pricing recovered nearly half of the earlier spike. This is the recurring tension in a rate-watcher’s year. The data that is bad for the job market is usually good for the borrower. Still, the recovery came late in the week, so the effective move finished modestly higher even after the bounce.
3. The Fed and a market leaning toward hikes
The Fed held the funds rate at 3.50% to 3.75% at its June 16 to 17 meeting. Chair Kevin Warsh, who took over in mid-May, has emphasized disciplined inflation control and financial stability. Meanwhile, inflation is tracking its highest level since 2022. So the market is now pricing a higher chance of a rate hike this year rather than a cut. That is the overhang I am watching most closely. A soft jobs number helps the doves. Even so, it will take more than one report to change the near-term path.
The 10-Year Treasury and Mortgage Rate Spreads
The spread is the gap between the 30-year fixed and the 10-year Treasury. This week it ran about 1.98%, or 198 basis points (6.43% minus 4.46%). That is down roughly 13 basis points from the prior week’s 210 basis points.
The 10-year Treasury ended near 4.46%, up about 7 basis points from the prior week’s 4.39%. Quarter-end volatility pushed yields higher, before Thursday’s jobs report pulled them part of the way back. The spread narrowed because the weekly survey moved lower while the 10-year moved higher. That reflects the survey’s lag more than any real repricing of mortgage credit. On an effective daily basis, mortgage rates tracked the Treasury higher. So the narrowing spread is partly a measurement artifact this week, not a clean sign of a more efficient mortgage market.
Nashville mortgage rates take their base from the 10-year. So a yield drifting higher on quarter-end mechanics is worth watching, but not worth overreacting to. The spread sits well inside the 246 basis point average recorded since Freddie Mac changed the PMMS methodology in November 2022. As a result, there is room for borrower pricing to improve if the volatility fades and the 10-year settles. That is the more likely path once the calendar noise clears.
Payment Impact for Nashville Buyers
At this week’s 6.43% 30-year survey rate, the principal and interest payment on a $500,000 loan runs about $3,137 per month. That is down roughly $20 from the prior week’s 6.49%. Keep in mind, though, that effective daily pricing sat a touch higher by week’s end. So a quote you receive today may not match the survey average exactly.
On a $1,000,000 loan, common in the Williamson County and luxury segments I work in, principal and interest at 6.43% runs about $6,275 per month. At this loan size, the buyers I represent watch builder concessions and rate buydowns closely. On new construction, those can move the effective payment more than a week of quarter-end noise ever will.
For investors weighing short-term rental acquisitions, financing costs still sit above the long-run norm. That keeps the math tight on debt-financed deals. The East Nashville market remains a focus for buyers running these numbers, where the entry price changes the payment calculus relative to the downtown core. A 198 basis point spread is still the number I tell investors to underwrite to. I would not build a deal around the survey lows holding into next week.
Strategic Borrower Considerations in Today’s Market
When the survey and the daily tape disagree, the borrowers who win act on the actual quote in front of them, not the headline. This week made the point cleanly. The survey printed new 2026 lows while effective pricing finished higher. So a buyer who assumed the headline meant a lower lock would have been surprised at the rate sheet.
The band I guide buyers to is simple. Get fully underwritten before you shop. A verified pre-approval lets you act on a genuine dip inside a single day. Quarter-end weeks are exactly when the gap between the headline and the real quote is widest. So being ready matters more, not less.
A 15-year at 5.79% against a 30-year at 6.43% remains a real fork for buyers with the cash flow to carry the higher payment. For the right balance sheet, the 64 basis point gap is worth a hard look. That is especially true with the near-term path of the 30-year uncertain.
Nashville Real Estate Market Outlook
The calendar is relatively light next week, but a few releases can still move rates. The biggest is the minutes from the June Federal Reserve meeting. They should offer the first detailed look at the Committee’s thinking under Chair Warsh. Key reports include S&P Global PMI, ISM Services, weekly jobless claims, and existing home sales. Any of these can nudge yields. The Treasury will also auction 3-year, 10-year, and 30-year securities. Weak demand at those auctions can push yields higher and ripple into the mortgage market.
Stepping back, this Fourth of July also marks the halfway point of 2026. The economy is still expanding, but the picture is mixed. Growth has held up better than many expected, and the labor market remains a pillar even as hiring moderates. Inflation, however, is on track to close the first half at its highest since 2022. The one encouraging thread is energy. Oil has fallen sharply back to pre-Iran-conflict levels, which could mark the high-water mark for inflation if it holds. For the broader local picture, see our Nashville market analysis. The next Federal Reserve meeting runs July 28 to 29, 2026.
My read for Middle Tennessee buyers and sellers heading into the week: on an effective basis, rates are higher than they were seven days ago. Still, they sit below the early-June and mid-May peaks. So this is not a moment to panic in either direction. If you are close to a decision, this is a good window to get your financing buttoned up before the next round of data. And if you want my read on how this week’s pricing affects a specific purchase or listing, that conversation is usually faster than another lap through the rate headlines.
Nashville Mortgage Rates FAQ
What are Nashville mortgage rates today?
For the week ending July 3, 2026, Nashville mortgage rates averaged 6.43% on the 30-year fixed and 5.79% on the 15-year fixed, per Freddie Mac PMMS. FHA 30-year pricing ran near 6.17%. Daily lender quotes can differ based on credit profile, loan size, and property type. Effective daily pricing also finished the week a touch above the survey average.
Did Nashville mortgage rates go up or down this week?
It depends on the measure. The Freddie Mac weekly survey fell 6 basis points on the 30-year, to a 2026 low of 6.43%. Effective daily pricing, however, rose about 7 basis points. The survey reads lower mainly because it has not captured a midweek quarter-end spike. On the ground, borrowers saw slightly higher rates than last week.
Why did the survey fall if daily rates rose?
The Freddie Mac survey is a weekly average that lags daily pricing. It also dilutes any single day by averaging it with the prior business days. Rates spiked midweek on quarter-end volatility, then recovered part of the move after a weak jobs report. The survey caught the lower early-week readings but not the full spike. So it printed lower even though effective pricing ended higher.
What is the mortgage spread and why does it matter?
The mortgage spread is the difference between the 30-year fixed rate and the 10-year Treasury yield. It ran about 198 basis points this week (6.43% minus 4.46%). It reflects the efficiency of the mortgage-backed securities market. The spread narrowed this week largely because the weekly survey lagged a rising 10-year. So the move is partly a measurement effect, not a clean sign of improving mortgage credit.
When is the next event that could move rates?
Next week brings the minutes from the June Federal Reserve meeting, plus S&P Global PMI, ISM Services, jobless claims, and existing home sales. The Treasury also auctions 3-year, 10-year, and 30-year securities. The next Fed meeting runs July 28 to 29, 2026. Any of these can move the 10-year Treasury and, with it, local mortgage rates.
How much would a $500,000 loan cost per month at today’s rate?
At this week’s 6.43% 30-year survey rate, the principal and interest payment on a $500,000 loan is about $3,137 per month. A $1,000,000 loan runs about $6,275 per month in principal and interest. Taxes, insurance, and HOA dues are additional, and daily lender pricing will vary.
Sources and methodology
Rate data in this update reflects weekly averages from the Freddie Mac Primary Mortgage Market Survey (PMMS) for the week ending July 3, 2026. Daily lender pricing context is sourced from the Mortgage News Daily rate index. Macro indicators including the 10-year Treasury yield reference Federal Reserve Economic Data (FRED) series DGS10. The daily close is cross-checked against the Mortgage News Daily 10-year reference. Spread analysis between mortgage rates and the 10-year Treasury uses the PMMS minus DGS10 series. Payment figures use the standard amortization formula for principal and interest only. Year-over-year comparisons reference the same Freddie Mac PMMS week from the prior year.
- Freddie Mac Primary Mortgage Market Survey (PMMS), week ending July 3, 2026: https://www.freddiemac.com/pmms (retrieved July 3, 2026)
- Mortgage News Daily rate index, daily 30-year, 15-year, FHA, and jumbo lender pricing: https://www.mortgagenewsdaily.com/mortgage-rates (retrieved July 3, 2026)
- FRED DGS10, 10-year Treasury Constant Maturity Rate (Board of Governors of the Federal Reserve System): https://fred.stlouisfed.org/series/DGS10 (retrieved July 3, 2026)
- Federal Reserve H.15 Selected Interest Rates (10-year Treasury daily close): https://www.federalreserve.gov/releases/h15/ (retrieved July 3, 2026)
- Federal Reserve FOMC calendar (June 16 to 17 meeting; next meeting July 28 to 29, 2026): https://www.federalreserve.gov/monetarypolicy/fomccalendars.htm (retrieved July 3, 2026)
- U.S. Bureau of Labor Statistics, Employment Situation (June 2026 released July 2, 2026; July 2026 releases August 7, 2026): https://www.bls.gov/schedule/news_release/empsit.htm (retrieved July 3, 2026)
- U.S. Bureau of Labor Statistics, Consumer Price Index (May 2026 release, Core CPI YoY): https://www.bls.gov/cpi/ (retrieved July 3, 2026)
- Mortgage Bankers Association, Weekly Applications Survey: https://www.mba.org/news-and-research/research-and-economics/single-family-research/weekly-applications-survey (retrieved July 3, 2026)
Verified broker authority: 25 years of Middle Tennessee brokerage and over $1 billion in career closings at Compass RE.
Commission and compensation disclosure: Broker fees are not set by law and are fully negotiable. There is no standard or going commission rate. All commission and buyer-agency details should be discussed before contract. This applies to all representation by Grant Hammond at Compass RE.
Mortgage rates change daily. The rates referenced above are the Freddie Mac PMMS weekly average for the week ending July 3, 2026. Daily lender quotes will differ based on credit profile, loan size, property type, and lock period. Nothing in this analysis constitutes a rate lock guarantee or a commitment to lend. Speak with a licensed mortgage professional for personalized pricing.
Forward-looking statement: Any commentary on the direction of rates, Treasury yields, Federal Reserve policy, or the Nashville real estate market reflects observations as of July 3, 2026, and is not a forecast or a guarantee. Markets can move quickly and unpredictably. Make financing and real estate decisions based on conditions at the time of your transaction, not on this analysis.