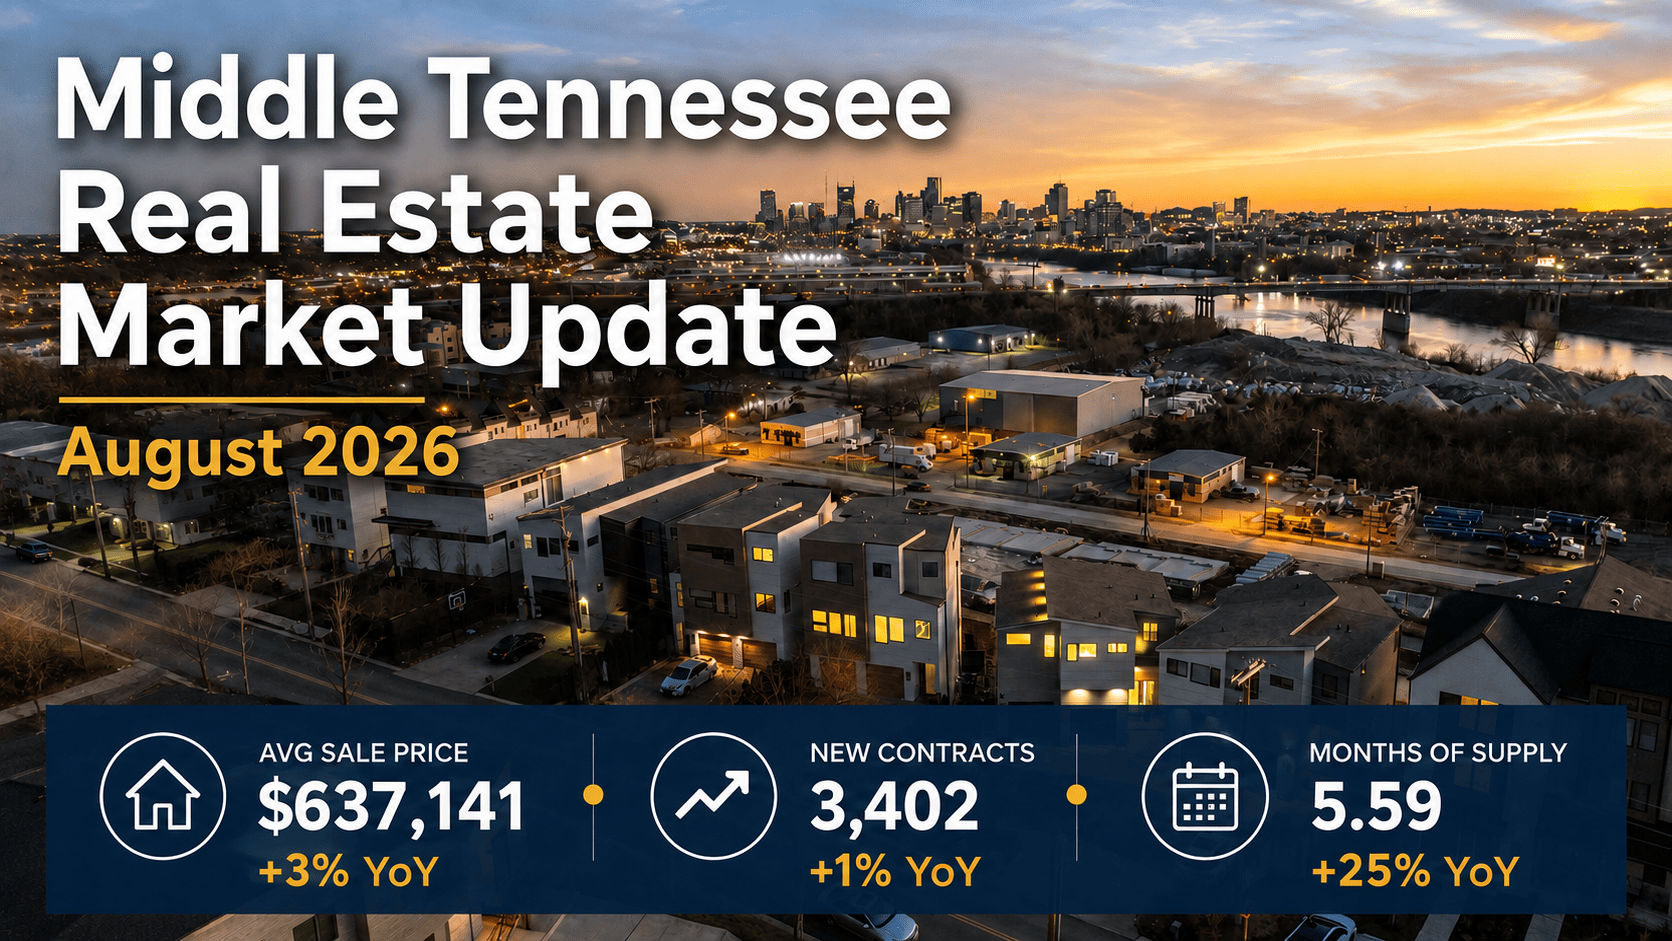
The Nashville housing market and the broader Middle Tennessee real estate market closed August 2026 with active inventory up 10% year over year to 14,294 homes, months of supply above 5 for the first time in this series at 5.59, and the average sale price up 3% to $637,141. The median was flat at $450,000.
The region is carrying 10% more active listings than a year ago while sellers list fewer homes. Read that twice. Supply grows even though fewer people are selling, which only happens when homes stop clearing. Months of supply rose every month this summer, and August pushed it to the top of the balanced range.
The risk in this market is not a crash. It is stagnation. Fewer people are listing, fewer people are closing, and prices have stopped moving, all at the same time. A market where nobody sells and nobody buys looks fine on a price chart right up until you are the one who needs to transact in it.
I publish on the 2nd because current information beats perfect information. The volume counts are two days old and will move. I have measured exactly how much, and I show the work below. The corrected figures go up on the 9th. You can track the financing side weekly on my Nashville mortgage rate tracker, and the full archive lives in my Nashville housing market analysis category.
Middle Tennessee Housing Market Key Takeaways: August 2026
- Active inventory rose 10% to an average of 14,294 homes
- Months of supply hit 5.59, up from 4.46 last August and above 5 for the first time in this series
- Total inventory rose 6% to 19,672
- Average sale price rose 3% to $637,141
- Median sale price was flat at $450,000 against $449,000 a year ago
- Davidson County hit 6.89 months of supply, the loosest in the region
- Closings fell 14% to 3,003, the weakest August in three years, against 3,491 last August and 3,466 in 2024
Middle Tennessee Real Estate Market Data: August 2026
All residential sales across the ten-county region: Davidson, Williamson, Rutherford, Wilson, Sumner, Maury, Montgomery, Robertson, Dickson, and Cheatham. Source: Realtracs MLS, report date September 2, 2026.
| Metric | Aug 2025 | Aug 2026 | YoY |
|---|---|---|---|
| New Listings | 6,783 | 5,537 | −18% |
| New Under Contract | 3,382 | 3,402 | +1% |
| Active Inventory (Avg) | 13,039 | 14,294 | +10% |
| Under Contract Inventory (Avg) | 5,514 | 5,378 | −2% |
| Total Inventory | 18,554 | 19,672 | +6% |
| Closings | 3,491 | 3,003 | −14% |
| Sale Price (Avg) | $619,425 | $637,141 | +3% |
| Sale Price (Med) | $449,000 | $450,000 | 0% |
| Avg DOM (Closed) | 33 | 34 | +4% |
| Avg List Price (Active) | $770,403 | $794,951 | +3% |
| List to Contract (Avg) | 57 | 59 | +4% |
| Contract to Closed (Avg) | 46 | 42 | −10% |
| List to Closed (Avg) | 99 | 98 | −1% |
| Months of Supply | 4.46 | 5.59 | +25% |
Why These Numbers Will Change, and By How Much
How the Reporting Lag Works
Most Nashville housing market reports wait until the 10th. Here is why that matters. A closing on August 28 does not become a closed record when the deed transfers. An agent has to mark it closed, and that takes a day to two weeks. So when I pull on the 2nd, August is still missing sales while August 2025 has been complete for a year.
Every volume comparison published this early is biased toward showing a steeper decline than actually happened. That is not a Realtracs problem or a Nashville problem. It is arithmetic, and it applies to every early-month Nashville housing market report you will read this week, including the ones that do not mention it.
What June and July Actually Revised
I can put numbers on it, by comparing what I published in June and July against what those months look like now.
| Metric | June as first reported | June one month later | July as first reported | July one month later |
|---|---|---|---|---|
| New listings | 5,984 | 7,002 | 5,864 | 6,463 |
| New under contract | 3,811 | 3,540 | 3,394 | 3,224 |
| Closings | 3,467 | 3,794 | 3,428 | 3,654 |
| Active inventory (avg) | 13,748 | 13,751 | 14,174 | 14,177 |
| Months of supply | 4.80 | 4.39 | 4.92 | 4.62 |
First-reported figures from my June and July reports. Revised figures from Realtracs MLS, report date September 2, 2026.
The pattern held both months. Closings revised up 9% and 7%. New listings up 17% and 10%. New contracts down 7% and 5%, because some fall through. Active inventory moved by three homes, because it is a snapshot rather than a count of events someone has to report.
What That Implies for August
That last row is the useful one. Inventory is measured. Volume is reported. Only one of those is trustworthy on day two.
So here is the call. August closings land near 3,250, turning a 14% decline into 7%. New listings come in near down 8%, not down 18%. New contracts go slightly negative. Months of supply settles at 5.2. I publish the actual numbers on September 9 and you can grade my prediction. The settled August figures, and how this call scored, are in my September 2026 Middle Tennessee market update.
Why the Nashville Housing Market Is Behaving This Way
The region is carrying 10% more active inventory than a year ago and 6% more total inventory, while sellers list fewer homes. Homes are arriving slower than they are piling up. That is a loosening market.
Rates Held Inside a Two-Basis-Point Band
Financing explains why. The 30-year averaged 6.66% for the week ending August 27, per Freddie Mac, with the 15-year at 5.98%. Rates moved inside a two-basis-point band all month and sat a tenth above last year. No shock in August. No relief either.
Three Months of Rates, and What Demand Did
The weekly survey tells the story better than any single reading. Here is the summer, with what the Nashville housing market did alongside it.
| Month | 30-yr avg | Weekly range | New contracts YoY |
|---|---|---|---|
| June 2026 | 6.49% | 6.47–6.52% | +4% |
| July 2026 | 6.54% | 6.43–6.66% | −6% |
| August 2026 | 6.67% | 6.65–6.69% | +1% |
30-year fixed weekly averages, Freddie Mac PMMS. Contract activity, Realtracs MLS.
Rates bottomed at 6.43% on July 2, then climbed 26 basis points to 6.69% by August 6. Demand fell the month rates rose and steadied the month they stopped. Zoom out and the year is one grind: the 2026 low was 5.98% in February, so spring ran on a 6% mortgage and summer ran on a 6.67% one. That is the whole difference between contracts up 18% in April and flat in August.
The Fed Is Leaning Hawkish
The Federal Reserve held at 3.50% to 3.75% on July 29. The vote was 9 to 3, with three regional bank presidents dissenting for a quarter-point hike, the first time since 2016 that three members broke the same direction. Headline CPI ran 3.4% in July with core at 2.5%, per the Bureau of Labor Statistics. The 10-year closed August at 4.75% and trades near 4.80% today.
Some of that pressure is not American. Japanese government bond yields broke out this summer, the 10-year JGB near 2.96% and the 30-year in record territory. Japanese institutions have been among the largest foreign buyers of US Treasuries for twenty years, and they bought because yields at home were nailed to the floor. That is over. When a Tokyo insurer gets 3% at home without currency risk, the bid for our 10-year thins, and thin demand means higher yields.
Your mortgage rate in Franklin is partly set in Tokyo, and almost nobody in this business is watching it. The Fed sets the short end. Mortgages take their cue from the 10-year, and the 10-year has a global order book. That is why cooling inflation has not delivered a cheaper mortgage, and why inventory does not clear.
This market is not supply-driven. It is still financing-driven, and it has been all year. What changed in August is that the cost of that financing stopped being a shock and started being a condition. Buyers have adjusted to 6.66%. They have not adjusted to what 6.66% does to the house they actually wanted.
How the Nashville Housing Market Got Here: Summer 2026 in Review
Three months of data frame the summer in the Nashville housing market.
| Month | New Listings (YoY) | New Contracts (YoY) | Avg Active Inventory | Median Sale Price | Months of Supply |
|---|---|---|---|---|---|
| June 2026 | −2% | +4% | 13,751 | $470,000 | 4.39 |
| July 2026 | −11% | −6% | 14,177 | $455,000 | 4.62 |
| August 2026 | −18% | +1% | 14,294 | $450,000 | 5.59 |
All three months drawn from Realtracs MLS, report date September 2, 2026. Source: Realtracs MLS.
Three Lines Moving the Same Direction
Inventory climbed every month, from 13,751 in June to 14,177 in July to 14,294 in August, up 10% year over year. New listings ran 2% below prior year in June, 11% in July, 18% in August. The lock-in effect is the reason: homeowners carrying 3% and 4% mortgages have no reason to trade into a 6.66% loan, and every month at this level hardens that decision.
Demand did not pick up the slack. Contracts ran up 4% in June, down 6% in July, up 1% in August. That is flat, not recovering. And the median slid from $470,000 to $455,000 to $450,000, landing within $1,000 of where it sat last August. Supply up, demand flat, prices still. Pick any two and you have a soft patch. All three at once is something else.
Did My July Forecast Hold Up?
Half right. In July I said that if rates held in the mid-to-upper 6s, supply would climb 0.1 to 0.25 points a month and hit 5.4 to 6.2 by year-end. Rates held and supply climbed. But I built that projection off July’s 4.92, which settled to 4.62, so the baseline was wrong and the pace estimate was far too slow. Supply jumped 0.6 points in August alone.
The fix, applied from here forward: anchor to inventory, not to supply ratios, until the volume settles. First-of-month months of supply runs a third of a point high. I knew the lag existed and modeled off the number anyway.
Closed Home Price Trends Over the Last 12 Months in Middle Tennessee
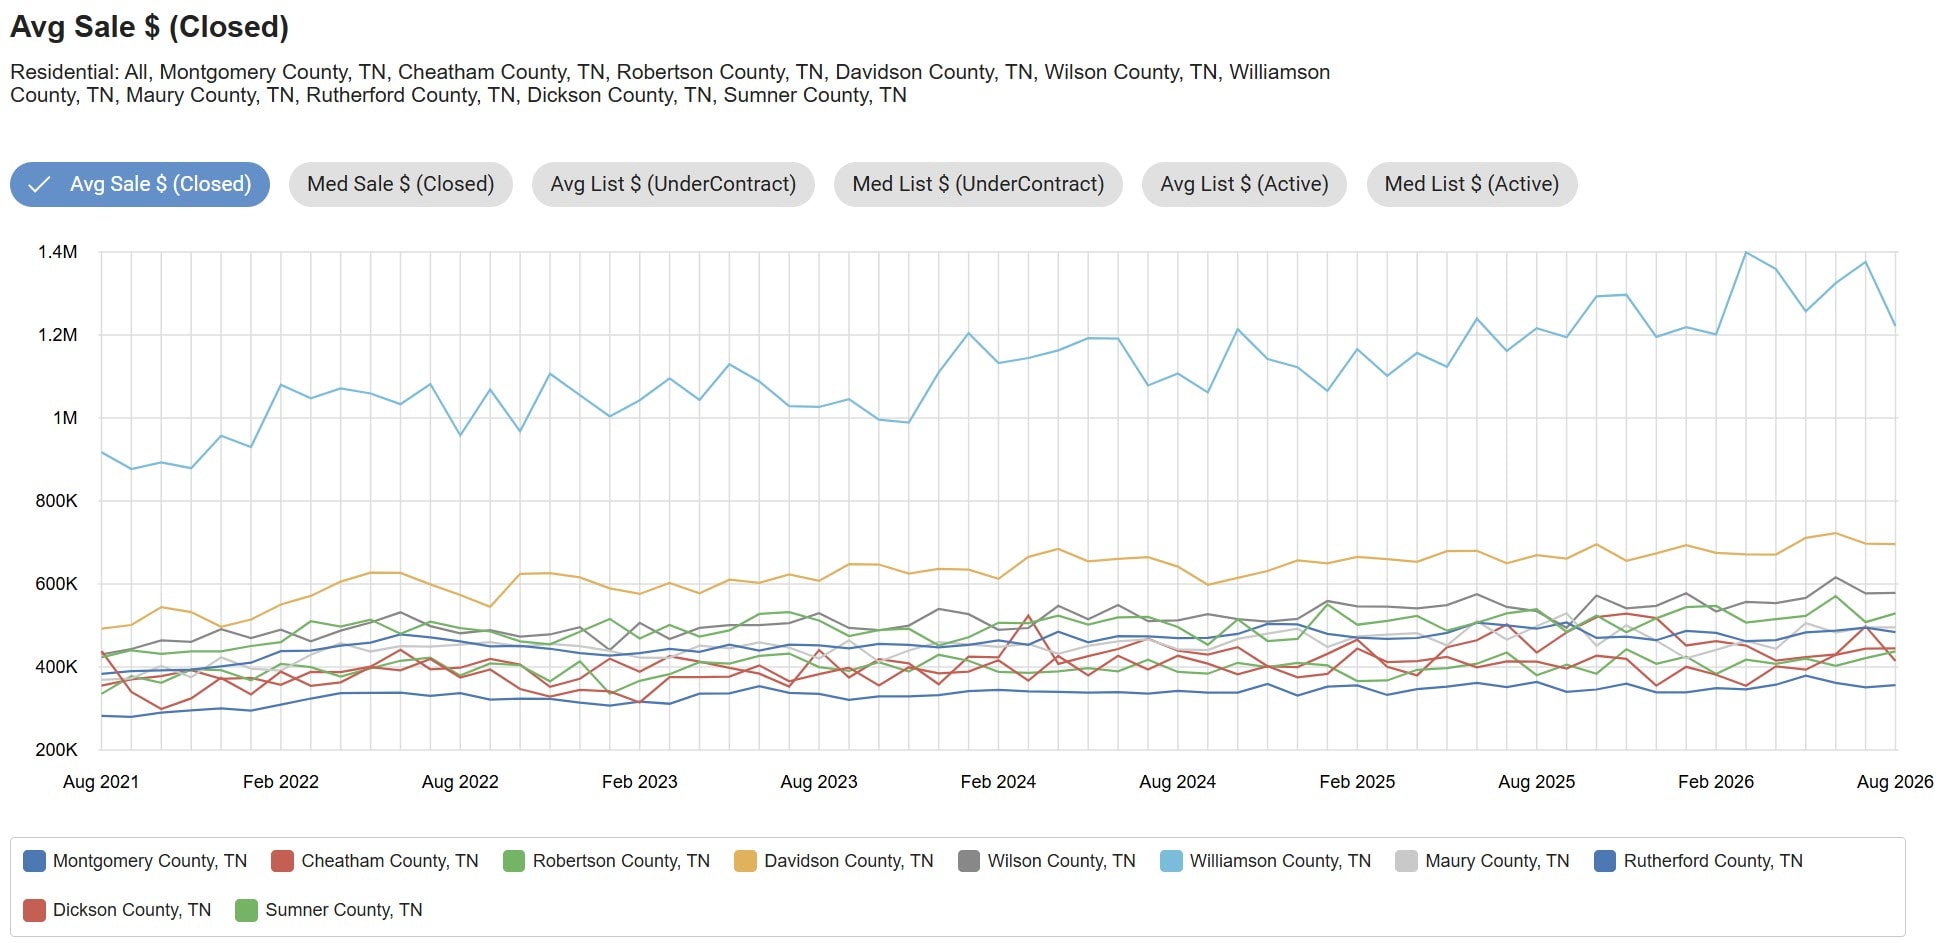
Average Sale $ (Closed), trend by county through August 2026. Source: Realtracs MLS.
The Average-to-Median Spread Keeps Widening
The average rose 3% to $637,141 while the median went from $449,000 to $450,000. That $187,141 spread is wider than the $170,425 gap a year ago, and it tells you where the strength lives. Williamson County closed at a $1,221,471 average, near the top of a five-year run that started around $910,000 in 2021. The middle of the market, the segment most exposed to a 6.66% mortgage, stopped producing gains entirely this summer.
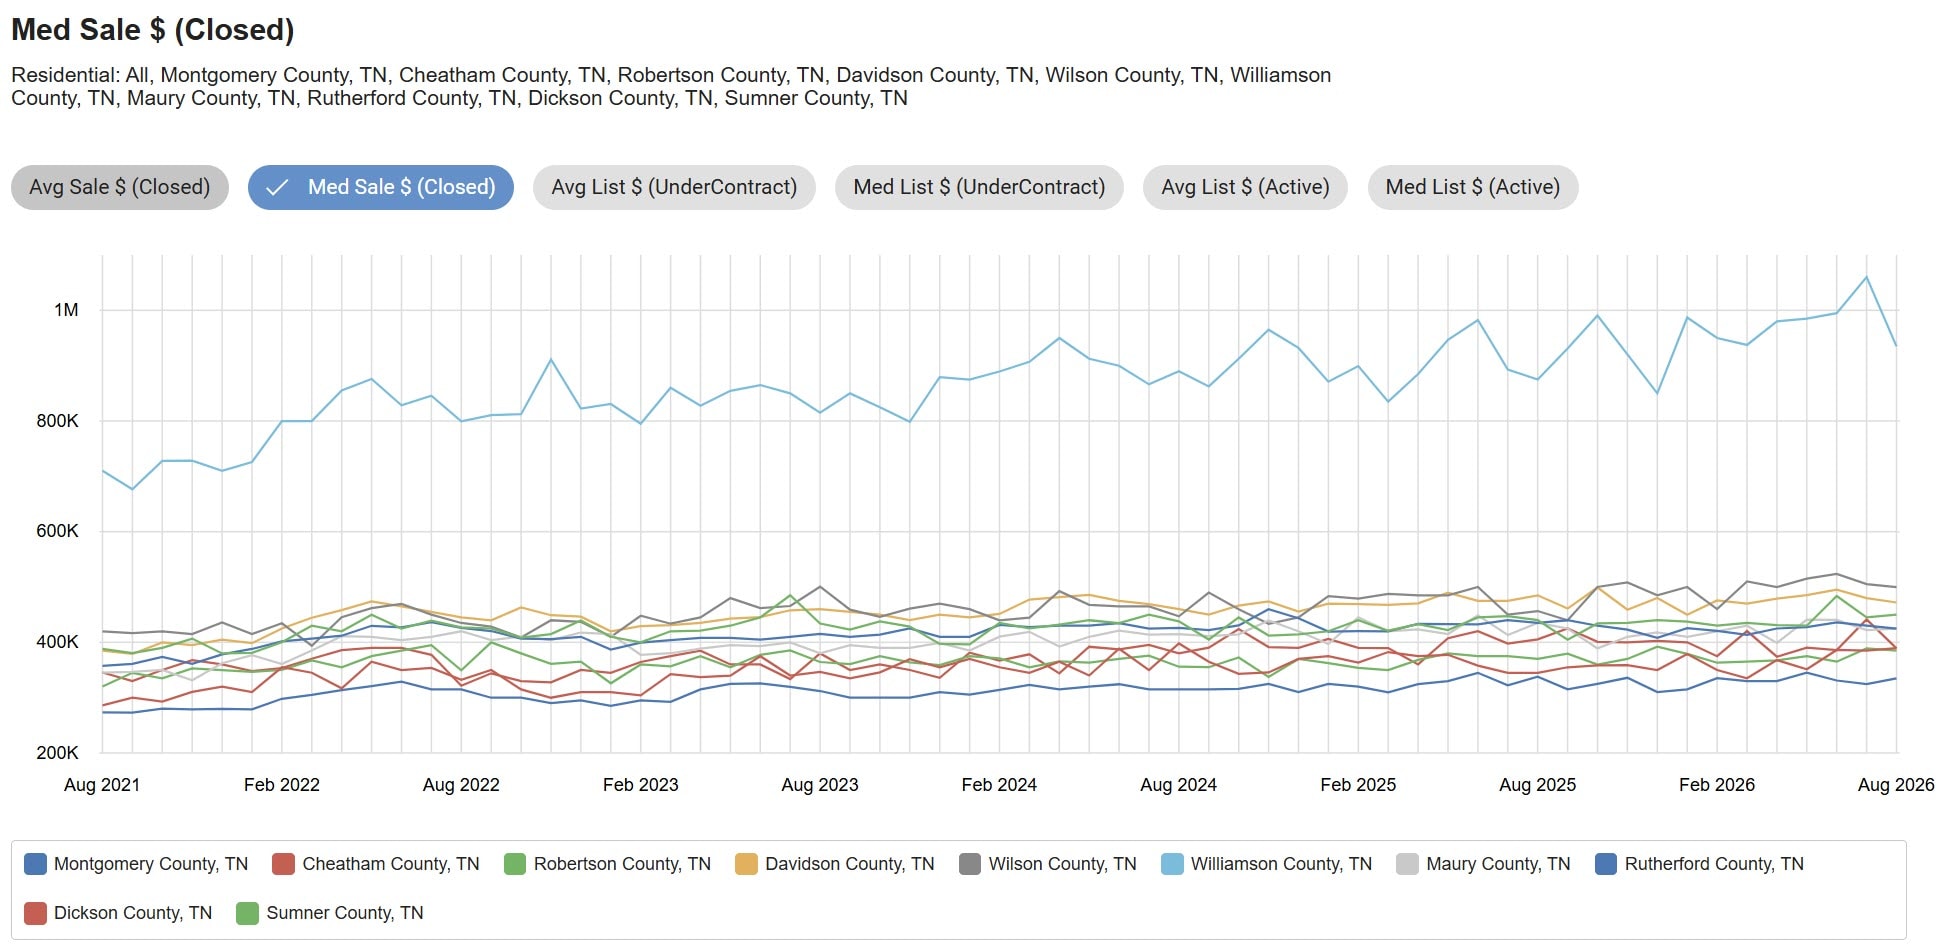
Median Sale $ (Closed), trend by county through August 2026. Source: Realtracs MLS.
The median chart shows the compression. Outside Williamson at $934,950, the other nine cluster between $335,000 and $499,900, a band that has barely widened in five years.
This is not broad appreciation. It is selective price strength in a rate-constrained market, and the two look identical until you separate the average from the median.
A rising average against a flat median means appreciation is earned by specific homes, not granted to the market. Well-located, turnkey, priced to the last 90 days of comps: still transacting. Priced to a 2022 memory: joining a 14,294-home pool that grew 10% while the buyer pool did not. The market is not going to argue with you about your list price. It is just going to leave you on it.
County-Level Real Estate Trends in Middle Tennessee
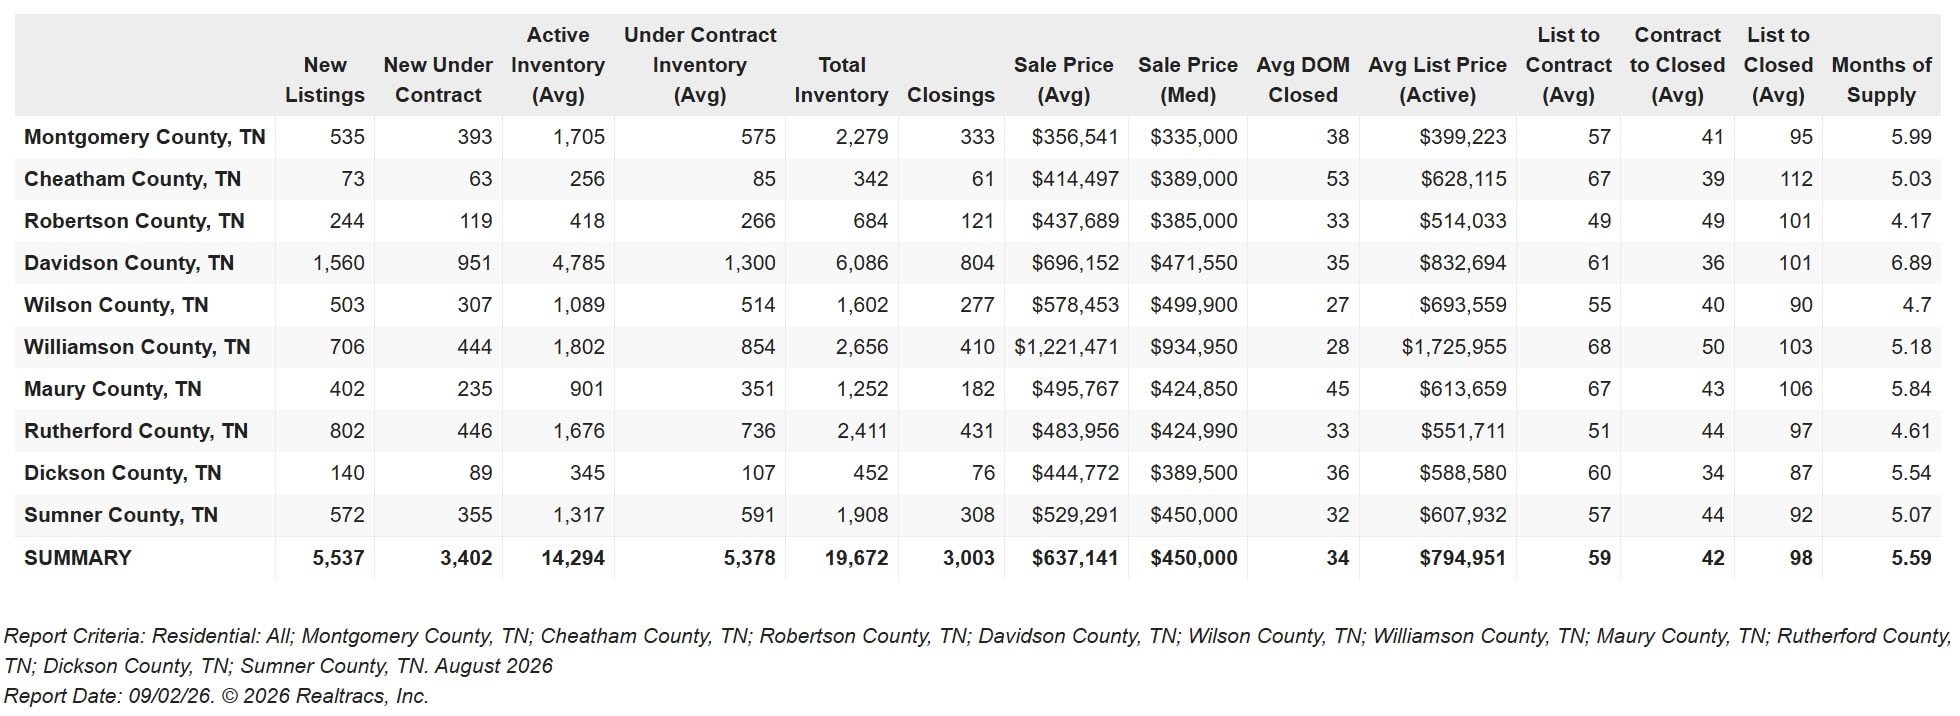
County-by-county data table. Source: Realtracs MLS, August 2026.
The spread is the story. Davidson County is the loosest submarket in the Nashville housing market and the only one past the 6-month buyer’s-market line, at 6.89 months on 4,785 active listings. Robertson is tightest at 4.17, then Rutherford at 4.61 and Wilson at 4.70, where homes still move in 27 days. That is a 2.7-month gap inside a region people talk about as one market.
Williamson County still sets the ceiling at a $1,221,471 average and a $934,950 median on 5.18 months, with move-up and relocation demand concentrated in Franklin and Brentwood. Green Hills and East Nashville run on different clocks inside Davidson. Montgomery anchors affordability at a $335,000 median, and Maury sits at 5.84 months with a 106-day pipeline.
What Months of Supply Means in the Nashville Housing Market
Months of supply measures how long it takes to sell every active listing in the Nashville housing market at the current closing pace. Under 4 favors sellers. Four to 6 is balanced. Above 6 favors buyers.
August reads 5.59 and settles at 5.2, keeping Middle Tennessee inside the balanced band but at the top of it. August 2025 read 4.46; the summer ran 4.39, then 4.62, then 5.2.
Middle Tennessee is not tipping into a buyer’s market. It is drifting there, one month at a time. In 25 years here I have seen this region under 2 months of supply in 2021 and well past 6 after 2008. The single print never matters. The run does, and this market has posted three straight months of year-over-year supply increases.
Nationally the existing-home market carried 4.6 months in July, unchanged from June and a year earlier, per the National Association of Realtors. Middle Tennessee now sits above the national figure, a reversal from where the region has been for five years.
Nashville Housing Market Forecast: Where Middle Tennessee Is Headed
The rest of 2026 hinges on the same variable it always has. Three scenarios, and as of September 2 the futures market favors the third.
If rates ease into the low 6s, inventory is what moves first. Payment-sensitive buyers come back fast, and at a 42-day contract-to-closed cycle it shows in closed data inside six weeks. Supply compresses quicker than the current trend implies. Price gains stay selective, because the constraint here is affordability in the middle of the market, not scarcity.
If rates hold in the mid-to-upper 6s, the build runs into winter. The region sits at 5.2 today, and December and January always read higher than fall. On this path Middle Tennessee crosses 6 months before spring and joins Davidson County on the wrong side of the line.
If rates rise, demand contracts instead of drifting. This is no longer the tail scenario: three dissents for a hike in July, minutes flagging more tightening, a 10-year at 4.80%, and futures pricing a September hike at 64%. Even here, the seller shortfall is the floor. You do not get broad price declines while new listings run below prior-year levels every single month.
For most of this year the through-line was selectivity: the good homes still trade. This summer it started looking like something else. Stagnation is volume falling on both sides while prices hold, and the longer rates sit at 6.66%, the harder those two are to tell apart.
What to Watch in the Nashville Housing Market in September
Three things between now and month end will tell you more about where the Nashville housing market is going than anything in the August data.
The September 15 and 16 Fed Meeting
The FOMC meets September 15 and 16, one of four meetings a year carrying a Summary of Economic Projections. That means an updated dot plot, so the market gets the Committee’s own rate path instead of guessing. Read the July vote before assuming relief is coming: three dissents for a hike, minutes flagging tightening if inflation stalls, a 10-year at 4.80%.
The market has moved with it. CME FedWatch put the odds of a quarter-point hike at this meeting near 64% on September 2, up from even money a week earlier. That number moves daily. The direction of travel does not.
A rate cut is not the base case this fall. A hike is. If you are waiting for a better rate before you buy or sell, you are betting against the futures market.
The Fall Window Is Narrower Than Spring
September and early October are the year’s second transaction window. The buyer pool thins through late October and does not come back until February. At 59 days list-to-contract, a home listed in mid-October is negotiating over the holidays. Sellers have six weeks of normal traffic left, against 14,294 active listings. That rewards early and correctly priced, not optimistic and patient.
If You Are Under Contract Right Now
The 10-year rose every day of the last week of August and has kept climbing into September. Lock or float is a conversation for you and your lender, not a call to make off a market report, but have it this week instead of the week before closing. Futures are pricing a hike 14 days out.
What This Means for Buyers, Sellers, and Investors
Buyers: This is the strongest buyer position of the cycle. 14,294 active listings, up 10%, means real leverage on anything sitting past 30 days. Davidson County is the clearest opening in the region. Ask for price, closing costs, and a rate buydown, and ask on the same listing. One caveat: well-priced homes still go under contract inside a month, and stale inventory is usually stale for a reason.
Sellers: A flat median against a 10% bigger competitive set is the signal. List-to-contract is 59 days. Price to the last 90 days of comps on day one. That 3% average growth is real but it lives in the upper tier, and pricing a mid-market home like it applies is how listings join the 14,294. If you need to move within a year, waiting is a bet that rates fall, and the Fed spent July telling you it is not in a hurry.
Investors: The opportunity here is inventory, not distress, and that distinction changes how you underwrite. Davidson County’s 4,785 active listings and region-leading supply is where the leverage is. Cheatham’s 112-day pipeline and Maury’s 5.84 months are where patient capital pushes hardest this fall. Robertson at 4.17 and Rutherford at 4.61 are where you compete instead of dictate.
After 25 years here, across luxury homes, 350-plus downtown high-rise condo closings, and 550-plus short-term-rental deals, one pattern holds: the months that look alarming in the headline are the months the mechanism is being misread.
August will get called a Nashville housing market slowdown. Wrong word. A slowdown still moves. August shows sellers who will not list, buyers who will not close, and a median that has not budged in a year, all arriving together.
The danger in Middle Tennessee right now is not falling prices. It is stagnation. Prices can hold at $450,000 for another year and it will still hurt, because the people who need to move are the ones who get stuck.
One thing breaks it, and it is the same thing that caused it. Rates. The catch is that the futures market spent the last week of August deciding rates go up on September 16, not down. If that holds, the stagnation gets worse before it gets better, and every month a seller waits for a friendlier market is a month the market moves the other way.
Nashville and Middle Tennessee Real Estate Market FAQ
What is happening in the Nashville housing market in August 2026?
Inventory is building and prices have flattened. Active inventory rose 10% to an average of 14,294 homes across the ten-county Middle Tennessee region, months of supply hit 5.59, and the average sale price rose 3% to $637,141 while the median held flat at $450,000. Closings fell 14% to 3,003, the weakest August in three years.
Are home prices in Middle Tennessee dropping?
No, but they have stopped rising in the middle of the market. The median was flat at $450,000 against $449,000 a year earlier, while the average rose 3% to $637,141. The widening gap means the remaining growth sits in the upper tier rather than across the market.
Is Middle Tennessee a buyer’s market in 2026?
The region is at the upper edge of balanced and Davidson County has crossed. Middle Tennessee sits at 5.59 months, inside the 4-to-6 band but at the top of it. Davidson reads 6.89, the loosest in the region. Robertson at 4.17 and Rutherford at 4.61 stay competitive for buyers.
Why do these numbers change after they are published?
Because I publish on the 2nd, before agents finish entering closings and listings into the MLS. June closings were first reported at 3,467 and settled at 3,794. July was first reported at 3,428 and settled at 3,654. Active inventory does not move, because it is a snapshot rather than a count of reported events, which is why I treat it as the most reliable figure in an early-month report.
Which Middle Tennessee counties are strongest right now?
Robertson is tightest at 4.17 months, then Rutherford at 4.61 and Wilson at 4.70. Wilson also has the fastest sales at 27 days on market. Williamson leads on price at a $1,221,471 average and $934,950 median, while Rutherford produced 431 closings, the most outside Davidson.
What would change this market for the rest of 2026?
Mortgage rates remain the steering wheel, and the next move points up rather than down. The Federal Open Market Committee meets September 15 and 16, and CME FedWatch put the odds of a quarter-point hike near 64% on September 2. A move back to the low 6s brings payment-sensitive buyers back and clears the inventory overhang in six weeks. Rates holding in the mid-to-upper 6s, or rising, push the Nashville housing market through 6 months of supply before spring.
- Middle Tennessee Real Estate Market Update July 2026
- Middle Tennessee Real Estate Market Update June 2026
- Nashville Housing Market 2026 Outlook
- Nashville Mortgage Rates Today
Data and disclosure: August 2026 Realtracs MLS figures are preliminary at report date September 2, 2026; counts post for about two weeks after month end, so volume comparisons against the settled August 2025 period overstate declines. Projected revisions are estimates derived from observed June and July 2026 revisions. June and July figures here are restated finals. Other sources as of September 2, 2026: Freddie Mac PMMS (8/27), FOMC statement (7/29) and minutes (8/19), BLS CPI (July, released 8/12), NAR existing-home sales (July, released 8/11). The 4.75% 10-year is the 8/31 constant-maturity close per Federal Reserve H.15; the 4.80% reference is a market level, not a close. Rate-hike odds are CME FedWatch market-implied probabilities that reprice continuously. Future performance may differ materially. This is not investment advice. Grant Hammond is a Tennessee-licensed broker (#261980) at Compass RE.
Full library of Middle Tennessee housing data, weekly mortgage-rate analysis, and condo, luxury, and Airbnb research at the Nashville real estate research hub.