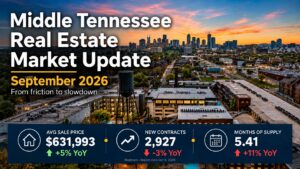
Middle Tennessee Real Estate Market Update September 2026
September 2026 Middle Tennessee real estate data shows active inventory up 8% year over year to 14,249 homes, months of supply at...
Updated September 6, 2026 · 36 posts in this archive · 2005 to 2026 · Nashville housing inventory levels from Grant Hammond
Quick answer: Nashville housing inventory levels, tracked period by period. Each entry reports active listings, months of supply and days on market, which together say whether the market is absorbing what gets listed or letting it sit. Inventory turns before price does, which is why it gets its own archive.
Nashville housing inventory levels from Grant Hammond, in date order. Figures come from Realtracs, the Middle Tennessee MLS, for the period each post covers, and the measures stay the same from entry to entry so the series can be read as one line. For prices against the same periods, see the Nashville housing market archive.
Active listings at the close of the period. Months of supply, derived from that inventory against the closing pace for the same period rather than carried over from a prior month. Days on market, and the direction it is moving. Breakouts by submarket and by price band where the sample supports it, because a shortage at one price point can sit alongside a glut at another. For county-level context see Davidson County real estate.
The long-standing rule of thumb is that roughly five to six months of supply describes a balanced market, below that favours sellers, and above it favours buyers. Treat that as a definition rather than a measurement: it is a benchmark the industry settled on, not a figure from any particular month in Nashville. What matters more locally is the direction and the price band. Months of supply can sit inside the balanced range metro-wide while entry-level inventory is genuinely scarce and the top of the market is oversupplied, and a single citywide number hides that completely. Each entry in this archive reports the measure alongside the bands so the average does not do the talking. For available listings now, see homes for sale.
Davidson County and Williamson County, across price bands from under $500K through $2.5M and above, with submarket breakouts where the sample carries them.
Grant Hammond is a Nashville real estate broker at Compass RE. He has 25 years of experience and over $1 billion in career sales across Davidson and Williamson Counties. Furthermore, his market analysis appears regularly in major publications, including the Wall Street Journal, the Los Angeles Times, The Tennessean, and the Nashville Business Journal. Tennessee Real Estate Broker License #261980.