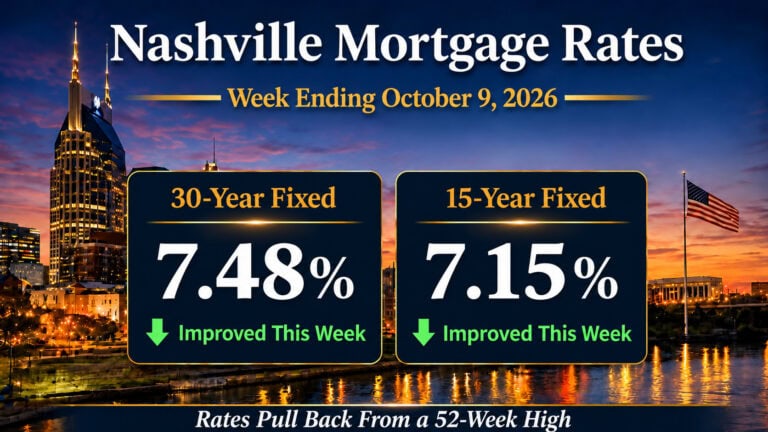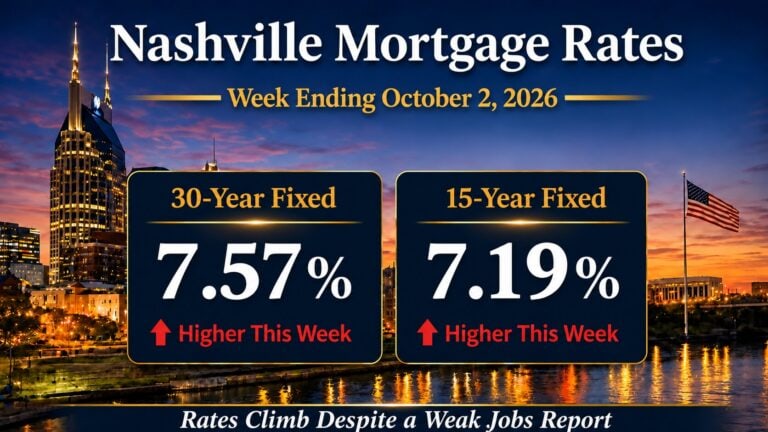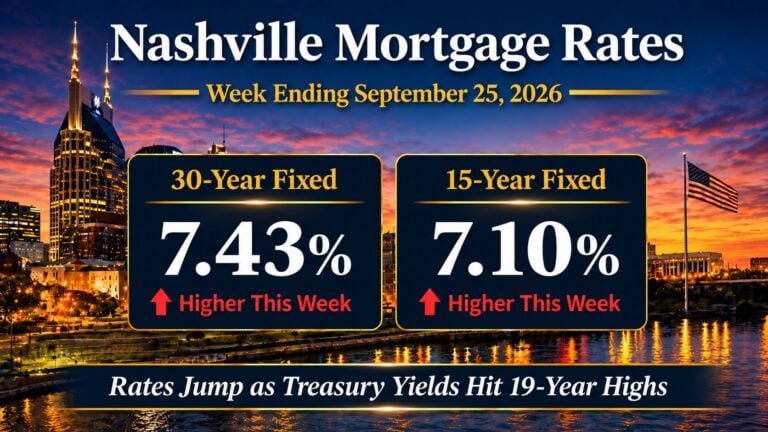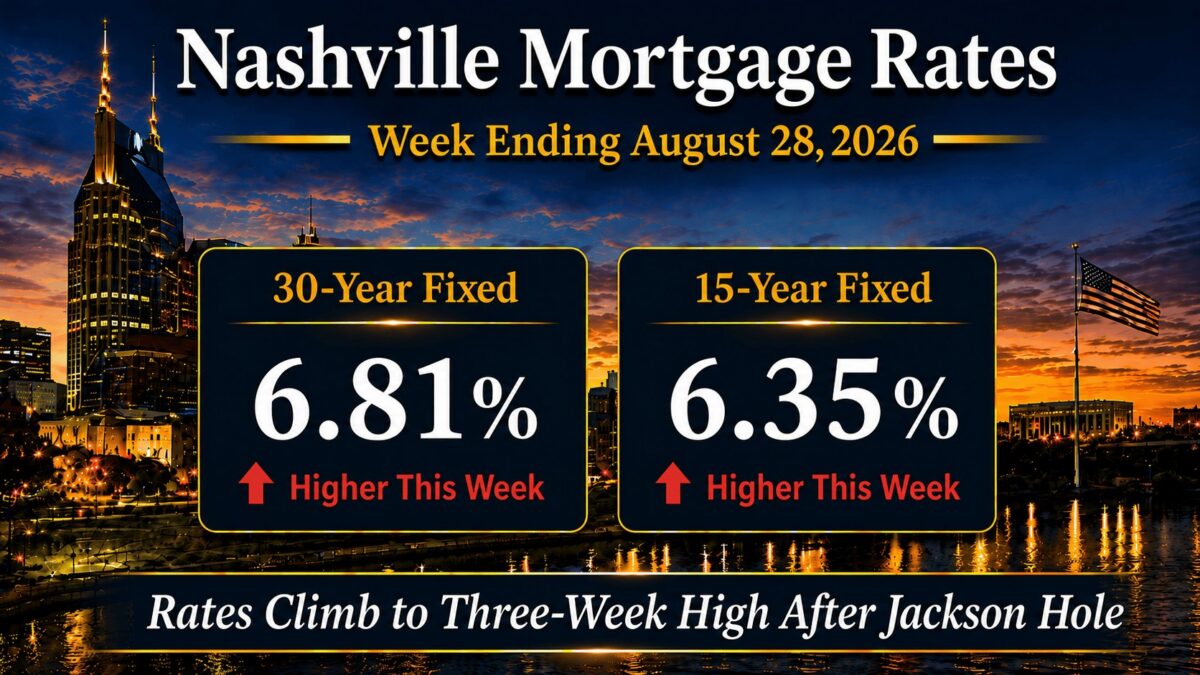
Nashville mortgage rates finished the week at 6.81% on the 30-year fixed and 6.35% on the 15-year fixed. Both figures are Friday, August 28, 2026 closes from the Mortgage News Daily Rate Index, which prices actual lender rate sheets rather than a weekly survey. The 30-year rose 4 basis points from 6.77% the previous Friday. The 15-year rose 4 basis points from 6.31%. Nearly all of that move landed in a single afternoon.
Four of the five sessions were quiet and improving. Then Fed Chair Kevin Warsh spoke at Jackson Hole on Friday morning, the bond market read him as hawkish, and the average lender repriced higher within hours. The 30-year went from 6.75% on Thursday to 6.81% at the close, its highest in just over three weeks. That is the whole week in two sentences.
I write this recap every Friday because the week does not end when the surveys close. The Freddie Mac number you will see quoted in headlines this week is 6.66%, collected before Warsh spoke. The number a Nashville borrower could actually lock on Friday afternoon was 6.81%. For the running figures between these posts, the Nashville mortgage rate tracker carries the current dashboard and payment math.
In this report
Market Summary
- Nashville 30-year fixed mortgage rates closed Friday at 6.81%, up 4 basis points from 6.77% the previous Friday and the highest in just over three weeks.
- Nashville 15-year fixed mortgage rates closed Friday at 6.35%, up 4 basis points from 6.31%.
- FHA 30-year rates closed at 6.37%, up 3 basis points on the day.
- The 10-year Treasury was quoted at 4.73% late Friday afternoon, up 3 basis points from 4.70% on the same basis the previous Friday.
- The mortgage spread was 1.98%, or 198 basis points, for the week on the Freddie Mac PMMS basis. On the daily lender index it was 208 basis points on Friday. Measured against official Treasury data it held between 203 and 210 basis points every day of the week, so it did not narrow.
- The Freddie Mac weekly survey, collected before Friday, averaged 6.66% on the 30-year and 5.98% on the 15-year. That is 15 basis points below where the rate sheet actually finished.
- July Core PCE rose about 0.2% for the month, an annualized pace near 2.4%. Roughly 40% of that increase came from portfolio management fees.
- Fed funds futures priced a 57.0% implied probability of a rate increase at the September 16 meeting on Friday, up from 39.9% a week earlier, per CME FedWatch.
- Oil eased into the lower $80s as Iran tensions cooled, and housing demand data softened again.
Daily figures come from the Freddie Mac PMMS comparison set and the Mortgage News Daily Rate Index, which prices a top-tier scenario at roughly 75% loan-to-value with excellent credit. Nashville borrowers with different credit profiles, loan sizes, or property types will see quotes above or below these figures.
Mortgage Rate Dashboard
The mortgage rate dashboard shows a 6.81% 30-year fixed rate, a 6.35% 15-year fixed rate, an FHA 30-year rate near 6.37%, a 10-year Treasury yield near 4.73%, and a mortgage spread near 1.98%, as of the week ending August 28, 2026. Every one of those figures is a Friday, August 28, 2026 close.
Nashville Mortgage Rates This Week
This is the first of these recaps built entirely on Friday closes, so the headline number is not directly comparable to the one I published last week. More on that below, because I would rather explain it than have you notice it.
The week in sequence
Monday and Tuesday improved on lower oil prices, as hopes for progress on Iran pulled crude and Treasury yields down together. Treasury buyback headlines ran again in the background and moved almost nothing, the second week running they have failed to hold a bid. Wednesday brought July Core PCE. Thursday the 30-year finished at 6.75%, unchanged on the day, and Mortgage News Daily titled its recap fairly calm.
Then Friday. Warsh spoke, the bond market sold off, and the average lender repriced. The 30-year closed at 6.81%. The saving grace is worth holding onto: Friday’s rate was only 4 basis points above the previous Friday, because four days of improvement had built a cushion for it to give back.
Why this week’s headline number changed
Through last week these posts led with the Freddie Mac survey, which is collected Monday through Wednesday and published Thursday. From this week they lead with Friday’s close, because this is a Friday post and a Friday post should tell you where the week actually ended.
The honest consequence: last week I published 6.65% and this week I am publishing 6.81%. That is not a 16 basis point spike. On a like-for-like Friday basis the week’s move was 4 basis points, from 6.77% to 6.81%. The other 12 basis points is the change of measure, not the market. The survey has not disappeared from this report. It has moved to where it belongs, as the benchmark I compare against.
What Warsh actually said
Three things, and the third moved the market. He described the economy and the labor market as strong. He called the 2% inflation target firm and fixed. Then he said current rate levels do not appear to be restraining financial conditions. Read together, that is a Chair telling you the Fed is in no hurry to cut and is willing to go the other way if inflation stays elevated. Fed funds futures agreed. A week earlier they priced a 39.9% implied probability of a September increase. By Friday that was 57.0%.
Institutional Macro Snapshot
What Is Driving Mortgage Rates Right Now?
Three forces set the price of a Nashville mortgage this week, and one of them did almost all the work in a single afternoon. Jackson Hole dominated. Underneath it sat a Core PCE report that was tamer than its headline suggested and an oil market that finally stopped hurting. That combination is why I read this week as a crossroads rather than a turn.
1. Jackson Hole repriced the week in one session
Warsh’s speech was the event the market had counted down to all week. The message landed hawkish and the reaction was immediate. Short-term Treasury yields rose more than a tenth of a point. Medium-term Treasuries, which are what actually drive mortgage pricing, took a good share of that pressure. The 10-year was trading near 4.73% late in the session, up roughly 6 basis points on the day, and the average lender moved the 30-year from 6.75% to 6.81%.
I want to be precise about what changed, because it was not the data. Wednesday’s inflation print had already landed and it was not alarming. What moved was the market’s read on how long policy stays restrictive, and whether the next move is even a cut. The Fed does not set mortgage rates. It sets the expectations the bond market prices, and this week it reset them.
2. July Core PCE was tamer than the headline, and the internals say so
Wednesday’s July Core PCE rose about 0.2% for the month, an annualized pace near 2.4%. Rounded, it matched forecasts. Unrounded it printed 0.247%, about as high as a number can get without rounding up, and I would not read much into a rounding artifact. Markets took it as a mild negative and moved on.
Here is the part almost nobody priced. The July Producer Price Index showed portfolio management fees up 6.5% for the month. Those fees feed into Core PCE and accounted for roughly 40% of July’s monthly core increase. Nearly half the move came from one category, and it is not a category higher interest rates can do anything about. Rate policy works on demand. It does not work on asset-management billing. Strip that component and the inflation picture underneath is closer to the Fed’s target than the headline implies, which is exactly why Friday’s hawkish tone sat so awkwardly on top of Wednesday’s data.
3. Oil stopped being the problem, and housing demand kept softening
Oil eased into the lower $80s as optimism around Iran reduced the immediate fear of military conflict. That reverses the story I told the last two weeks, when a Strait of Hormuz disruption was pushing crude and Treasury yields up together. Energy moves both actual inflation and inflation expectations, so I read a contained oil market as a genuine tailwind here. Monday and Tuesday’s improvement was almost entirely this.
Underneath the rate move, housing demand kept giving ground. New home sales gave back June’s gains. Mortgage applications remained stalled as rates moved higher, per the Mortgage Bankers Association weekly survey. Home price appreciation edged higher with a widening regional divide. For Nashville that combination matters more than a 4 basis point weekly move. Softer demand at these rate levels is what produces negotiating room on days on market and on concessions, and that is where I am seeing the actual leverage shift right now. The August 2026 Middle Tennessee market update puts numbers on it: active inventory up 10% to 14,294 homes, and months of supply at 5.59, above 5 for the first time in this series.
Here is what I do with that. Softer demand is only worth something if you ask for the right concession. Take the same $500,000 purchase I price out below. A $10,000 price reduction lowers the payment about $52 a month. The same $10,000 taken instead as a seller credit toward a permanent rate buydown is two and a half points on the loan, and if that buys half a point of rate, the payment falls about $132. Identical money out of the seller’s proceeds, roughly two and a half times the benefit to the buyer. Ask your lender what those points actually buy on your file first, because that pricing moves every week.
The 10-Year Treasury and Mortgage Rate Spreads
The mortgage spread is the Freddie Mac PMMS 30-year less the 10-year Treasury weekly average for the same week, both legs weekly. For the week ending August 28 that was 6.66% minus 4.68%, or 1.98%, which is 198 basis points. A week earlier, on the same weekly basis, it was 195.
Here is the part I think matters more than any single day. On the daily lender index I rebuilt every session of the week, pairing each day’s lender rate with the official Treasury constant maturity yield for that same day. It held in a narrow band the whole time.
| Day | 30-Year | 10-Year Treasury | Spread |
|---|---|---|---|
| Friday, August 21 | 6.77% | 4.74% | 203 bps |
| Monday, August 24 | 6.78% | 4.70% | 208 bps |
| Tuesday, August 25 | 6.74% | 4.64% | 210 bps |
| Wednesday, August 26 | 6.75% | 4.66% | 209 bps |
| Thursday, August 27 | 6.75% | 4.67% | 208 bps |
Every 10-year figure in that table is the official Treasury constant maturity yield, not a live market quote, and every mortgage rate is the dated daily index for the same day. That is the benchmark I will be carrying forward each week from here.
The 10-year spent four sessions drifting lower on oil and gave it all back on Friday. It closed Thursday at 4.67% and was trading near 4.73% late Friday afternoon, with the great majority of the week’s move arriving in a single session after the speech.
Notice what the table does and does not show. The Treasury fell 10 basis points from Friday to Tuesday and the mortgage rate barely followed, which is why the spread widened rather than narrowed. Borrowers did not get the benefit of that rally. They got it back as a wider spread.
A correction to how I have been measuring this
For the past month I calculated the spread by subtracting Friday’s Treasury yield from a survey rate collected on Thursday. Both figures were accurate. The subtraction was not. In a week where the Treasury rises on Friday, the survey never had the chance to answer it, and that one-day gap gets recorded as the spread tightening.
Recomputed properly, the spread did not narrow at all. The series I published across the past month showed a steady improvement that was not happening. Every basis point of it came from when the survey is taken rather than from the mortgage market getting cheaper. I would rather say that plainly than let it stand. The weekly table above is what replaces it, and the longer history is being rebuilt on official Treasury data before I put a multi-week trend back in front of you.
What would actually make pricing better
On the PMMS basis the spread has averaged 246 basis points since Freddie Mac changed the survey methodology in November 2022, and it sat well inside that all week. The pre-2022 survey-era norm was 171. On the PMMS basis the spread is already inside its post-2022 average, so further compression is a smaller lever here than the Treasury itself. That gap has largely closed since 2023, and I no longer think the data said it had.
There is a technical read worth carrying too. Bond prices are pressing against their 50-day moving average from below for the first time in some while. A sustained move above it would be the first real technical improvement of the quarter. A failure there leaves the market vulnerable to fresh 2026 price lows, which in yield terms means fresh 2026 rate highs. Prices and yields move opposite each other, so that chart is the cleanest single thing to watch next week.
The level I am watching is 4.75% on the 10-year. That is the 2026 high, and it has turned yields back every time they have reached it. This week closed roughly 2 basis points underneath it, the closest test yet. If that ceiling holds, the path from here is lower. If it breaks on a hawkish Fed narrative rather than an inflation print, 5.00% comes into view.
Payment Impact for Nashville Buyers
The comparison I run every week is a $500,000 purchase with 20% down and a $400,000 loan on a 30-year fixed. Principal and interest only, excluding taxes, insurance, HOA dues, and closing costs. At Friday’s 6.81% the payment is $2,610.37. At the previous Friday’s 6.77% it was $2,599.71. The weekly increase is $10.65 a month, or $3,835 across the full term.
Move the same math to the $1 million price point that dominates Brentwood, Franklin, and Green Hills. With 20% down, an $800,000 loan runs $5,220.73 at 6.81% against $5,199.42 at 6.77%. That is a $21.31 monthly increase and $7,670 over the term. Against the 6.50% rate of a year ago, that same $800,000 borrower is paying $164.19 more each month today.
Here is the part the headlines hide, and it is the figure I actually quote clients. The Freddie Mac survey average this week was 6.66%. That same $400,000 loan priced at the survey rate would run $39.86 a month less than it does at Friday’s 6.81%. On the $800,000 loan the gap is $79.72. That is not a discount anyone can claim. It is the distance between a survey taken midweek and a lock desk open on Friday afternoon.
For investors the arithmetic is different, because debt service is underwritten against rental income rather than a household budget. A 4 basis point weekly move is close to noise in that calculation. What matters is where the rate sits when the loan funds, and Friday moved that number 6 basis points in an afternoon. At these levels the debt-service coverage math still requires disciplined acquisition pricing on East Nashville homes and comparable inside-the-loop product.
Strategic Borrower Considerations in Today’s Market
Rates that move 4 basis points in a week do not change a purchase decision. A rate sheet that moves 6 basis points in an afternoon changes when you sign one. That is the distinction this week is really about.
- Buyers should plan against the daily quote, not the survey headline. Ask your lender what today’s actual pricing is on your file. A quarter-point difference between lenders is worth more than a month of this kind of movement.
- Sellers should read the demand data, not the rate headline. New home sales gave back June’s gains and applications stayed stalled. Pricing to the current payment band, rather than to spring comparable sales, is what produces offers inside 30 days.
- Investors are underwriting to debt service, not to sentiment. A refinance window depends on the 10-year respecting 4.75% and on the spread finally narrowing. On the PMMS basis it narrowed 5 basis points this month, so that case is modestly stronger than I described it last week.
- Move-up buyers carry the hardest math because they are trading a lower legacy rate for a larger balance. The question is not whether 6.81% is a good rate. It is whether the blended cost of the move clears the value of the house you actually want.
What I am telling clients this week
I have closed more than 550 short-term rental transactions in Middle Tennessee. In most of them the financing structure decided the deal before the price did. That is why DSCR and investor financing gets its own guide on this site rather than a paragraph.
My advice this week is narrow. If you have a file in underwriting and a lock window expiring inside 30 days, treat Friday as information rather than noise, and have the lock conversation before next Friday’s jobs report rather than after it.
Nashville Real Estate Market Outlook
Next week is the start-of-month data glut, and it is all labor market. ADP and JOLTS land midweek. The August Employment Situation from the Bureau of Labor Statistics follows on Friday, September 4, 2026. Collectively they are the last major read before the Federal Reserve’s September 15 and 16 meeting, which carries an updated Summary of Economic Projections.
What I am watching into the jobs report
Weaker employment data would challenge Warsh’s upbeat assessment of the labor market and help rates recover. Stronger data would reinforce Friday’s message and test 4.75% in earnest. I am watching the reaction more than the number. If a strong print pushes the 10-year through that level while the spread holds where it has sat all month, Friday’s 6.81% becomes the floor rather than the spike. If the print is soft and the ceiling holds, the question becomes whether the spread finally narrows, because that is the lever that has done nothing for four weeks.
Two Nashville segments respond first either way. Entry-level product under $450,000 in Davidson County, and the $750,000 to $1.5 million move-up band across Williamson County, where a $20 monthly change compounds into real qualification headroom.
For a longer view, last week’s rate update covers the prior week, though note it led with the Freddie Mac survey rather than the Friday close. Condo buyers working the FHA path should also check the FHA financing requirements for Nashville condos before assuming the 6.37% FHA note rate is available on a given building.
Nashville Mortgage Rates FAQ
What are Nashville mortgage rates today?
As of the Friday, August 28, 2026 close, the 30-year fixed was 6.81% and the 15-year fixed was 6.35%, per the Mortgage News Daily Rate Index. FHA 30-year was 6.37% the same day. The Freddie Mac weekly survey, collected earlier in the week, averaged 6.66% on the 30-year. Your actual quote will differ based on credit score, loan size, property type, occupancy, and lock period.
Did Nashville mortgage rates go up or down this week?
Up, and almost all of it on Friday. The 30-year rose 4 basis points from 6.77% on Friday August 21 to 6.81% on Friday August 28, 2026, with 6 of those basis points added on Friday alone after Chair Kevin Warsh’s Jackson Hole address. The 15-year rose 4 basis points from 6.31% to 6.35%. The 6.81% close is the highest in just over three weeks.
What is the mortgage spread and why does it matter in Nashville?
The mortgage spread is the Freddie Mac PMMS 30-year less the 10-year Treasury weekly average for the same week. For the week ending August 28, 2026 it was 6.66% minus 4.68%, or 1.98%, which is 198 basis points. On the daily lender index it held between 203 and 210 basis points on every session of that week. It matters because it is the second lever on your rate: none of this month’s rate movement came from the mortgage market. On the PMMS basis the spread already sits well inside its post-2022 average of 246 basis points.
What is the monthly payment on a $500,000 Nashville home right now?
Take a $400,000 loan on a 30-year fixed with 20% down. At Friday’s 6.81% close on August 28, 2026, principal and interest run $2,610.37 per month. That excludes property taxes, homeowners insurance, HOA dues, and any mortgage insurance. At the previous Friday’s 6.77% the same loan cost $2,599.71, so the week added $10.65 monthly. The 6.66% Freddie Mac survey average published the same week would price $39.86 a month lower, but that is the survey’s timing, not a rate any borrower could lock on Friday.
Are FHA rates lower than conventional rates in Nashville?
Yes, on the note rate. Mortgage News Daily showed the FHA 30-year at 6.37% on Friday August 28, 2026, against a 6.81% conventional index the same day. That is a gap of roughly 44 basis points. FHA also carries an upfront mortgage insurance premium of 1.75% plus an annual premium, so the all-in comparison depends on your down payment and how long you hold the loan. Have your lender run it on your specific file.
Will Nashville mortgage rates fall before the end of 2026?
The direction of travel changed on August 28, 2026. Chair Kevin Warsh called the 2% inflation target firm and fixed and said current rate levels do not appear to be restraining financial conditions. Fed funds futures moved to price a 57.0% implied probability of a rate increase at the September 15 and 16 meeting, which also carries an updated Summary of Economic Projections. The nearer catalysts are ADP, JOLTS, and the August Employment Situation on September 4, 2026. The 10-year was trading near 4.73% late Friday, close to the top of its 2026 range. Whether that level holds matters more for Nashville pricing over the next month than the September meeting does. Nothing here is a forecast or a rate guarantee. Make any lock decision with a licensed mortgage professional on current pricing.
Sources and methodology
Rate data and vintages
Every rate in this report is a Friday, August 28, 2026 close from the dated Mortgage News Daily Rate Index table stamped Last Updated 8/28/26. Week-over-week comparisons run Friday to Friday against August 21, 2026. Year-over-year figures use that same index’s published one-year change columns.
The daily spread table pairs each day’s Mortgage News Daily 30-year index with the official Treasury constant maturity yield for that same date. Those Treasury figures come from the Federal Reserve H.15 release of August 28, 2026, and were confirmed independently against FRED series DGS10.
The 10-year basis
The 4.73% shown in the dashboard is a live on-the-run market quote, captured late in the Friday session. The week-over-week comparison of 4.70% is the same quote type from the prior Friday, so the two are measured the same way.
The official constant maturity yield for August 28 was not yet published when this went out. That series appears in the H.15 release and in FRED as DGS10 on the following business day. So the dashboard figure and the daily table rest on different measures of the same benchmark. Where they disagree, the official series governs, and this post will be corrected if the settled figure differs materially.
Benchmarks and payment math
Weekly updates before this one led with the Freddie Mac Primary Mortgage Market Survey. That survey is collected earlier in the week and published Thursday, so those figures are left as published and are not directly comparable to the Friday closes reported here. The survey averages of 6.66% and 5.98% cited above are the August 27, 2026 release.
Core CPI is the July 2026 reading published by the Bureau of Labor Statistics on August 12, 2026. It is carried forward because no CPI release fell in this week. Payment figures use the standard amortization formula for principal and interest only, on a 30-year fixed with 20% down, excluding taxes, insurance, HOA dues, and closing costs.
Items resting on a single source
Four items come from lender market commentary rather than the primary agency. Those are July Core PCE, the July Producer Price Index portfolio-management-fee component, the Treasury buyback context, and the oil price level. They were not independently retrieved from the Bureau of Economic Analysis or the Bureau of Labor Statistics for this report.
The Fed funds futures probability was previously in that list. It is not any more. The 57.0% and 39.9% figures were read directly from CME FedWatch on August 29, 2026, for the September 16, 2026 meeting, with the tool stamped “Data as of 29 Aug 2026 11:22:23 CT.”
Sources retrieved August 29, 2026
- Mortgage News Daily Rate Index, dated daily history table, Last Updated 8/28/26. mortgagenewsdaily.com/mortgage-rates/mnd
- Mortgage News Daily Mortgage Rate Watch, “Mortgage Rates Jump to 3-Week Highs After Jackson Hole Speech,” August 28, 2026.
- Freddie Mac Primary Mortgage Market Survey. freddiemac.com/pmms
- Freddie Mac PMMS release, “Mortgage Rates Hold Steady,” August 27, 2026.
- Federal Reserve Economic Data, series DGS10, 10-Year Treasury Constant Maturity Rate. fred.stlouisfed.org/series/DGS10
- CME FedWatch, Target Rate Probabilities for the 16 Sep 2026 Fed Meeting, read August 29, 2026. cmegroup.com/markets/interest-rates/cme-fedwatch-tool.html
- Federal Reserve FOMC meeting calendar. federalreserve.gov/monetarypolicy/fomccalendars.htm
- U.S. Bureau of Labor Statistics, Consumer Price Index, July 2026, released August 12, 2026. bls.gov/cpi
- U.S. Bureau of Labor Statistics, Employment Situation release schedule. bls.gov/schedule/news_release/empsit.htm
About the broker and required disclosures
About the broker. Grant Hammond is a Tennessee-licensed real estate broker (TN Broker #261980) at Compass RE, leading BDG Partners. He has 25 years of Middle Tennessee brokerage experience and over $1 billion in career closings across Davidson and Williamson Counties.
Commission and compensation disclosure. Broker fees are not set by law and are fully negotiable. All commission and buyer-agency details should be discussed before contract.
Mortgage disclosure. Mortgage rates change daily. The rates referenced above are Friday, August 28, 2026 closes from a national daily index. Daily lender quotes differ by credit profile, loan size, property type, and lock period. Nothing in this analysis constitutes a rate lock guarantee or a commitment to lend. Speak with a licensed mortgage professional for personalized pricing.
Forward-looking statement disclosure. This post contains forward-looking observations about interest rates, Federal Reserve policy, and Middle Tennessee housing conditions. Those observations reflect conditions as of August 28, 2026 and are subject to change without notice. They are not predictions, guarantees, or investment advice. Actual outcomes may differ materially.
More Nashville mortgage analysis
- Nashville mortgage rates for the week ending September 18, 2026.
- Nashville Mortgage Rates Today, the live weekly tracker.
- Mortgage Rates and Financing archive, every weekly update.
- FHA-approved Nashville condo buildings.