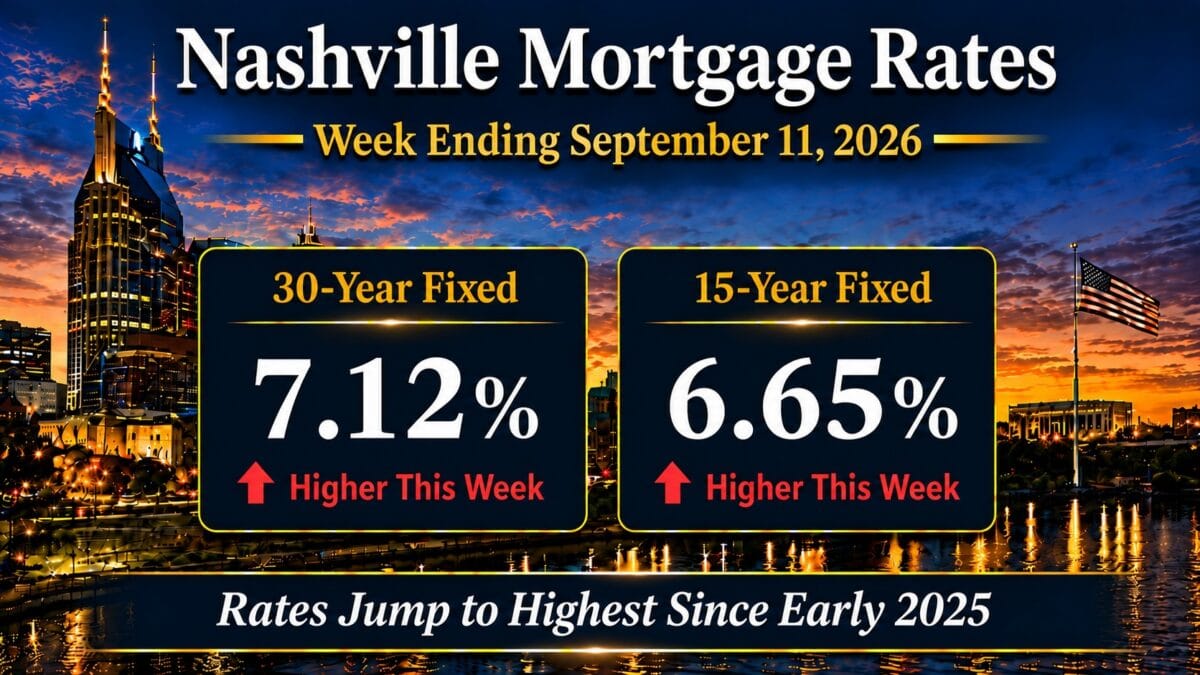
Nashville mortgage rates are 7.12% on the 30-year fixed and 6.65% on the 15-year fixed as of Friday, September 11, 2026, with FHA 30-year at 6.68%. The 30-year rose 23 basis points on the week from 6.89%, and the 15-year rose 16 basis points from 6.49%. Mortgage News Daily calls it the highest reading of its daily index since early 2025. These are Friday closes from the Mortgage News Daily Rate Index, which prices actual lender rate sheets rather than a weekly survey.
Two sessions did nearly all of the damage, and both were inflation data. The index rose 8 basis points Wednesday, then 10 more Thursday after a hot August producer price report landed on top of another jump in fuel prices. Friday added 5 late in the day, once a consumer inflation report that ran slightly warm had been digested. The 10-year Treasury told the same story. It closed Friday at 4.96%, its highest official close since the fall of 2023.
I publish this recap every Friday because the week does not end when the surveys close. The number that matters to a Nashville borrower is the one a lock desk will honor at 4 o’clock, not a survey average collected midweek. For where financing sits between these posts, start at my live weekly rate tracker. What I am watching now is not the mortgage rate itself. It is whether the 10-year finds buyers before 5.00%, the level where the last spike of this size turned around in October 2023.
In this report
Market Summary
- Nashville mortgage rates closed Friday at 7.12% on the 30-year, up 23 basis points on the week. Mortgage News Daily calls it the highest reading of its daily index since early 2025.
- The 15-year closed at 6.65%, up 16 basis points, so the gap between the two terms widened to 47 basis points from 40.
- FHA 30-year closed Friday at 6.68%, up 24 basis points from the previous Friday’s 6.44%, the largest move of the 3 headline terms.
- The 10-year Treasury closed Friday at 4.96%, up 18 basis points from 4.78% the previous Friday, per the official Treasury constant maturity series. Thursday’s 12 basis point jump was the largest single-day move of the week.
- The mortgage spread widened to 216 basis points from 211, both legs matched to the same Friday. Of the 23 basis point weekly move, 18 came from Treasuries and 5 from the spread.
- The Freddie Mac survey published Thursday, September 10 averaged 6.76% on the 30-year and 6.09% on the 15-year, up 5 basis points each.
- August CPI rose 0.4% on the month and 3.4% over the year. Core CPI rose 0.3% on the month and 2.4% over the year, down from 2.5% in July.
- August producer prices rose 0.4%. Oil climbed again on the Iran conflict, and 10-year yields in the United Kingdom, Japan and France reached multi-year or multi-decade highs.
- The Federal Reserve meets Tuesday and Wednesday, September 15 and 16, with a new Summary of Economic Projections. Fed funds futures priced an 86.5% probability of a quarter-point hike as of Friday, per CME FedWatch, up from 59.4% a week earlier.
Daily figures are the Mortgage News Daily Rate Index, priced on a top-tier scenario near 75% loan-to-value. Weekly survey figures come from the Freddie Mac PMMS, which averaged 6.76% and 6.09% this week. Your quote will differ by credit profile, loan size, and property type.
Mortgage Rate Dashboard
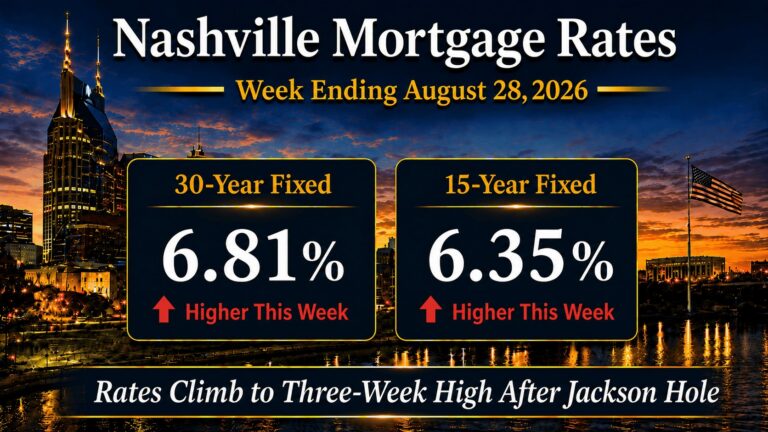
The mortgage rate dashboard shows a 7.12% 30-year fixed rate, a 6.65% 15-year fixed rate, an FHA 30-year rate near 6.68%, a 10-year Treasury yield near 4.96%, and a mortgage spread near 2.16%, as of the week ending September 11, 2026. All 5 figures carry the same observation date, so the spread is not distorted by pairing a midweek survey average with a Friday yield.
Nashville Mortgage Rates This Week
Last week I told you 15 month highs were not a break in the market. This week changed that read. 23 basis points in 4 sessions is the largest weekly move of 2026, and almost all of it came from 2 days of inflation data landing on a bond market that had already lost patience.
How did the week actually unfold?
Tuesday, the first session after Labor Day, was flat at 6.89%, unchanged from the previous Friday’s close. Wednesday the index rose 8 basis points to 6.97% after the Treasury announced the size of its next buyback program and the market had expected more. Buybacks temporarily add demand for Treasuries, so a smaller program means less demand and higher yields. The $39 billion 10-year auction the same afternoon drew decent demand, which was the one piece of good news in the bond market this week. Then Thursday did the damage. Producer prices for August rose 0.4%, fuel prices surged again, and the 10-year closed 12 basis points higher at 4.95%. Lenders repriced twice and the index finished at 7.07%, up 10 on the day.
Friday was the strange one. The consumer inflation report ran slightly warm, and futures pricing for a Fed hike next week rose from 72.4% Thursday to 86.5% by Friday’s close, per CME FedWatch. Yet the bond market improved through the morning. The logic was that a Fed more willing to act is good for long-term rates. That rally faded into the afternoon, the 10-year finished at 4.96%, and lenders added 5 basis points late in the day. I care more about that fade than about Thursday’s headline. A market that cannot hold a rally on cooperative logic is a market that wants to see 5.00%.
What does a 23 basis point week actually cost?
Here is the number that should concern Realtors: on a $400,000 loan this week added $61.80 to the monthly payment. That is 3 weeks of last week’s move in one. It is still smaller than the gap I routinely see between two lenders quoting the same borrower on the same afternoon.
The 15-year moved less than the 30-year for once. It rose 16 basis points against the 30-year’s 23. So the gap between the two terms widened to 47 basis points from 40. That restores some of the argument for the shorter term that went missing over the summer. I cover the math below.
Institutional Macro Snapshot
What Is Driving Mortgage Rates Right Now?
3 forces set the price of a Nashville mortgage this week, and the order matters. A global bond selloff set the stage, and a smaller-than-expected Treasury buyback announcement on Wednesday reminded the market how thin demand is. Two inflation reports and another leg higher in oil supplied the push.
Why is this a global bond selloff and not a Nashville story?
The 10-year Treasury pushed through 4.90% this week for the first time since October 2023. Painful, and also not primarily an American event, which is the point I keep making to clients. 10-year yields in the United Kingdom are above 5%, with 30-year gilts near 5.8%, levels last seen in the late 1990s. Japan’s 10-year has risen from just over 1% in early 2025 to around 3%. Its 30-year is above 4% for the first time since 1996. France’s 10-year crossed 4% for the first time since 2008. When Treasury Secretary Bessent says the United States is outperforming, that is the comparison he means.
The encouraging detail is that buyers showed up. Wednesday’s $39 billion 10-year auction was absorbed at these higher yields without incident. The market does not like where rates are. But at some level higher yields attract capital, and this week suggested that level is not far away. I have watched this pattern before. The last several times the 10-year traded between 4.50% and 5.00%, yields eventually reversed lower, though never on a schedule anyone published in advance.
What did the inflation reports do to rates?
Thursday’s producer price index for August rose 0.4%, and Mortgage News Daily attributed the day’s move half to that report and half to oil. The 30-year jumped 10 basis points, the largest single-day increase of the week. Producer prices feed the personal consumption expenditures index the Fed actually targets. That report lands at the end of the month, so the market treated Thursday as a preview.
Friday’s consumer price index rose 0.4% on the month and 3.4% over the year, which is the number I expect clients to quote back to me. Core CPI, which strips out food and energy, rose 0.3% and 2.4% over the year, down from 2.5% in July. That is the odd part of the week. Headline inflation is running hot on energy while core is drifting lower. A borrower feels the headline at the pump and the Fed watches the core. Next week the committee has to reconcile the two in one statement.
Why does oil keep setting the floor under rates?
Fuel prices surged again this week with the Iran conflict unresolved. Through this conflict, crude and Treasury yields have tracked each other closely. Energy feeds directly into inflation expectations, and inflation expectations set long-term yields. The overseas effect is worse. Economies that import most of their energy are pricing inflation they cannot control. That is a large part of why gilts and Japanese government bonds are where they are.
Across the Middle Tennessee files I am watching, the local read is narrower than the global one. A 23 basis point week changes the payment, and it has not yet changed the buyer pool in the price ranges where we transact. Negotiating room here still comes from time on market rather than from the bond market. That will change if 7% holds through the fall. I would rather tell you that now than after it shows up in the contract data.
The 10-Year Treasury and Mortgage Rate Spreads
The mortgage spread is the 30-year rate minus the 10-year Treasury yield, both measured on the same day. On Friday September 11 that was 7.12% minus 4.96%, or 2.16%, which is 216 basis points. The previous Friday it was 211. So of the 23 basis point weekly move in Nashville mortgage rates, 18 came from Treasuries and 5 came from the spread widening. Treasuries did the work; the mortgage market added a little on top.
Here is every session of the week, each day’s lender rate paired with the official Treasury constant maturity yield for that same day. Monday September 7 was closed for Labor Day. This week the Treasury published Friday’s yield the same afternoon, so the table carries both Fridays.
| Day | 30-Year | 10-Year Treasury | Spread |
|---|---|---|---|
| Friday, September 4 | 6.89% | 4.78% | 211 bps |
| Tuesday, September 8 | 6.89% | 4.80% | 209 bps |
| Wednesday, September 9 | 6.97% | 4.83% | 214 bps |
| Thursday, September 10 | 7.07% | 4.95% | 212 bps |
| Friday, September 11 | 7.12% | 4.96% | 216 bps |
Every 10-year figure in that table is the official Treasury constant maturity yield, and every mortgage rate is the dated daily index for the same day. Nothing in it is a live quote. The spread sat between 209 and 216 basis points all week. Lenders passed the Treasury move through almost one for one, then widened out a little on Friday.
What does the 4-week spread series show?
Two weeks ago I published a 4-week series showing the spread doing nothing, from 209 to 208 basis points. Here is the same series rolled forward, each Friday of the past month with both legs matched to that Friday.
| Week ending | 30-Year | 10-Year Treasury | Spread |
|---|---|---|---|
| Friday, August 21 | 6.77% | 4.74% | 203 bps |
| Friday, August 28 | 6.81% | 4.73% | 208 bps |
| Friday, September 4 | 6.89% | 4.78% | 211 bps |
| Friday, September 11 | 7.12% | 4.96% | 216 bps |
Across those 4 Fridays the spread went from 203 to 216 basis points, 13 wider in 3 weeks. That is no longer a spread doing nothing. 3 consecutive weeks of widening while Treasuries also rise is the pattern I least like to see. It means the mortgage market is adding its own risk premium on top of the bond market’s. Against a long-run norm of roughly 170 to 180 basis points, the spread is now the larger of the two problems a Nashville borrower has.
Why does 5.00% on the 10-year matter?
Seeing the 10-year clear 4.75% and then 4.90% in two weeks has created a gravitational pull toward 5.00%. The last time it got there, in October 2023, the visit was short. The 10-year fell below 3.90% by the end of that year, and mortgage rates followed it down by more than a full point. Whether that ceiling attracts buyers again is the single most important question for Nashville mortgage rates this fall.
Run the arithmetic rather than the anxiety. If the 10-year reached 5.00% and the spread stayed at 216 basis points, the 30-year would price near 7.16%. That is 4 basis points above Friday’s close, or about $10.81 a month on a $400,000 loan. In other words, the market has already priced most of the trip to 5.00%. The risk from here is not the last 4 basis points of Treasury yield. It is a spread that keeps widening while everyone stares at the Treasury.
Payment Impact for Nashville Buyers
The comparison I run every week is a $500,000 purchase with 20% down and a $400,000 loan on a 30-year fixed. At Friday’s 7.12% close that prices at $2,693.52 in principal and interest, excluding taxes, insurance, HOA dues, and closing costs. At the previous Friday’s 6.89% the same loan cost $2,631.73. The week added $61.80 a month.
Move that to the $1 million price point that dominates Brentwood, Franklin, and Green Hills. With 20% down, an $800,000 loan runs $5,387.05 at 7.12% against $5,263.45 at the previous Friday’s 6.89%. Call it $123.60 a month, and 3 weeks of moves like this one add up to roughly $370.
Quote the survey gap to clients, because they will see the survey number in the news. That same $400,000 loan priced at Freddie Mac’s 6.76% would run $96.47 a month less. On the $800,000 loan the gap is $192.94. It is not a discount anyone can claim. It is the distance between a survey that averaged 4 holiday-shortened days ending Wednesday and a lock desk open on Friday afternoon. In a week like this one, every one of those days was higher than the last.
The 15-year math improved relative to the 30-year. Put that same $400,000 loan on a 15-year term at 6.65% and it runs $3,517.50 a month, or $823.98 more. Over the life of the loan that saves roughly $336,519 in total interest. A 47 basis point gap between the terms is still thin by historical standards, but it is 7 basis points better than last week. For a borrower with the income to carry the payment, the shorter term now earns a second look it did not earn in August.
Strategic Borrower Considerations in Today’s Market
23 basis points on the week does change a purchase decision at the margin, and pretending otherwise would be dishonest. It changes what a given income can qualify for, and it changes how much room a seller has to hold a spring number. What it does not change is the structure of the decision.
- Buyers should plan against the daily quote, not the survey headline. This week the gap between them was 36 basis points, the widest I have seen this year, and it will close only when the daily index stops moving.
- Sellers should price to what buyers can actually afford today, not to summer comparable sales. The buyer qualifying at 7.12% carries $62 a month less house on a $400,000 loan than the buyer who qualified 3 weeks ago, and that shows up in days on market first.
- Investors underwrite to debt service, not sentiment. A refinance window needs the 10-year back under 4.75% and the spread narrowing, and both moved the wrong way this week. Acquisition pricing has to carry the deal on East Nashville homes and comparable inside-the-loop product at today’s rate, not a hoped-for one.
- Move-up buyers carry the hardest math, trading a low legacy rate for a larger balance. The question is not whether 7.12% is a good rate. It is whether the blended cost clears the value of the house you actually want, and at 7% the answer depends on the legacy rate more than the new one.
What am I telling clients this week?
I have closed more than 550 short-term rental transactions in Middle Tennessee. In most of them the financing structure decided the deal before the price did. That is why DSCR and investor financing gets its own guide on this site rather than a paragraph.
When I am advising on a lock this week the answer is specific. If your file is in underwriting and closes inside 30 days, Wednesday’s Fed decision is the event. The hike itself is priced; the statement and the projections are not. I would rather you be locked before it than float through it. If you are floating on a longer timeline, I am not going to pretend anyone can time this. What matters more for your search is that a rate near 7% changes which house your payment buys, not whether you can buy at all. A 15 minute call with your lender beats a weekend of refreshing rate tables.
One more thing I say to clients in weeks like this. A fixed payment does not rise with inflation, and the balance behind it shrinks in real terms every year inflation runs above zero. That is the one structural advantage a borrower at 7.12% still holds. It is the reason I do not tell anyone to wait for a rate nobody can forecast.
Nashville Real Estate Market Outlook
Next week belongs to the Federal Reserve. The committee meets Tuesday and Wednesday, September 15 and 16, releases its decision at 2:00 p.m. Eastern on Wednesday, and publishes a new Summary of Economic Projections alongside it. 3 of the 12 voters wanted a quarter-point hike at the July meeting. As of Friday, fed funds futures gave that outcome an 86.5% probability, per CME FedWatch, against 59.4% the Friday before and 48.4% a month ago. A hike is now the base case, and the market spent this week pricing it.
What am I watching into the Fed meeting?
The rate decision matters less to Nashville mortgage rates than the balance sheet does. The Fed controls short-term rates directly. It influences the 10-year and everything priced off it only through its balance sheet and its willingness to talk about long-term yields. So the sentences I will read first on Wednesday are the ones about the balance sheet. I want to see whether the committee acknowledges that long-term rates have already tightened financial conditions for it.
A hike with a hawkish projection set could, oddly, help. That was Friday’s lesson: a Fed seen as willing to fight inflation lets long-term yields relax. Because the hike is already 86.5% priced, the surprise risk runs the other way. A hold with no comment on the long end reads as inaction and sends the 10-year to test 5.00%. Oil is the variable nobody can model. As long as the Iran conflict is unresolved, it keeps a floor under yields regardless of what the Fed says.
Two Nashville segments respond first either way, in my experience. One is entry-level product under $450,000 in Davidson County, where a $62 monthly change is a qualification question. The other is the $750,000 to $1.5 million move-up market across Williamson County. There the legacy rate on the departing house now matters more than the rate on the new one.
For the prior week, last week’s rate update covers the jobs report and the 4.75% break. Condo buyers working the FHA path should check the FHA financing requirements for Nashville condos before assuming the 6.68% FHA note rate is available in a given building.
Nashville Mortgage Rates FAQ
What are Nashville mortgage rates today?
As of the Friday, September 11, 2026 close, the 30-year fixed was 7.12%, the 15-year fixed was 6.65% and the FHA 30-year was 6.68%, per the Mortgage News Daily Rate Index. The Freddie Mac weekly survey published September 10, 2026 averaged 6.76% on the 30-year and 6.09% on the 15-year. Your actual quote will differ based on credit score, loan size, property type, occupancy, and lock period.
Did Nashville mortgage rates go up or down this week?
Up, sharply. The 30-year rose 23 basis points from 6.89% on Friday September 4 to 7.12% on Friday September 11, 2026. The 15-year rose 16 basis points from 6.49% to 6.65%. Wednesday added 8 basis points, Thursday 10 and Friday 5, per the Mortgage News Daily Rate Index. Mortgage News Daily describes Friday’s 7.12% as the highest reading of its daily index since early 2025.
What is the mortgage spread and why does it matter in Nashville?
The mortgage spread is the 30-year rate minus the 10-year Treasury constant maturity yield, measured on the same day. On Friday September 11, 2026 it was 7.12% minus 4.96%, or 2.16%, and it ran between 209 and 216 basis points across the week’s sessions. It matters because it is the second lever on your rate. Across the 4 Fridays from August 21 to September 11, 2026 it widened from 203 to 216 basis points. The mortgage market added 13 basis points of its own on top of the Treasury move. A spread returning toward its long-run 170 to 180 range would lower Nashville mortgage rates without the Treasury moving at all.
What is the monthly payment on a $500,000 Nashville home right now?
Take a $400,000 loan on a 30-year fixed with 20% down. At Friday’s 7.12% close on September 11, 2026, principal and interest run $2,693.52 per month, excluding property taxes, homeowners insurance, HOA dues, and any mortgage insurance. At the previous Friday’s 6.89% the same loan cost $2,631.73, so the week added $61.80 monthly. The 6.76% Freddie Mac survey average published September 10, 2026 would price $96.47 lower, but that is the survey’s timing, not a rate any borrower could lock on Friday.
Are FHA rates lower than conventional rates in Nashville?
Yes, on the note rate. Mortgage News Daily showed the FHA 30-year at 6.68% on Friday September 11, 2026, against a 7.12% conventional index the same day, a gap of 44 basis points. FHA also carries an upfront mortgage insurance premium of 1.75% plus an annual premium. So the all-in comparison depends on your down payment and how long you hold the loan. Have your lender run it on your specific file.
Will Nashville mortgage rates fall before the end of 2026?
The next catalyst is the Federal Reserve meeting on September 15 and 16, 2026, which carries a new Summary of Economic Projections. Fed funds futures priced an 86.5% probability of a quarter-point hike as of September 11, 2026, per CME FedWatch, and 3 of 12 voters preferred a hike at the July 29, 2026 meeting. The 10-year Treasury closed Friday September 11, 2026 at 4.96%, its highest since 2023. Whether it is turned back at 5.00% matters more for Nashville mortgage rates than the meeting itself. August core CPI, released September 11, 2026, eased to 2.4% from 2.5%, which is the one number arguing for relief. Nothing here is a forecast or a rate guarantee. Make any lock decision with a licensed mortgage professional on current pricing.
Sources, methodology, and disclosure
Rates are Friday, September 11, 2026 closes from the Mortgage News Daily Rate Index, read from its dated history tables. The 10-year is the official U.S. Treasury constant maturity yield from the Treasury’s Daily Par Yield Curve for Friday, September 11, 2026, and the spread pairs the 30-year and 10-year for that same Friday. Week-over-week comparisons are Friday to Friday for every instrument. Freddie Mac figures are the Primary Mortgage Market Survey released September 10, 2026. Inflation figures are the Bureau of Labor Statistics CPI and PPI releases for August 2026. The federal funds range is from the Federal Reserve’s July 29, 2026 statement. Payment figures use the standard amortization formula, principal and interest only. Fed funds futures probabilities are the CME FedWatch tool as of September 11, 2026. Daily driver attribution follows Mortgage News Daily’s Mortgage Rate Watch commentary for September 9, 10 and 11, 2026. Oil levels, overseas yields, the Treasury Secretary’s remarks and the 10-year auction result come from lender and market commentary rather than a primary agency.
Broker fees are not set by law and are fully negotiable. Commission and buyer-agency terms should be discussed before contract. Mortgage rates change daily and lender quotes differ by credit profile, loan size, property type and lock period. Nothing here is a rate lock guarantee, a commitment to lend, or investment advice. Forward-looking observations reflect conditions as of September 11, 2026 and are subject to change.
More Nashville mortgage analysis
- The live weekly rate tracker, updated between these posts.
- Mortgage Rates and Financing archive, every weekly update.
- FHA-approved Nashville condo buildings.