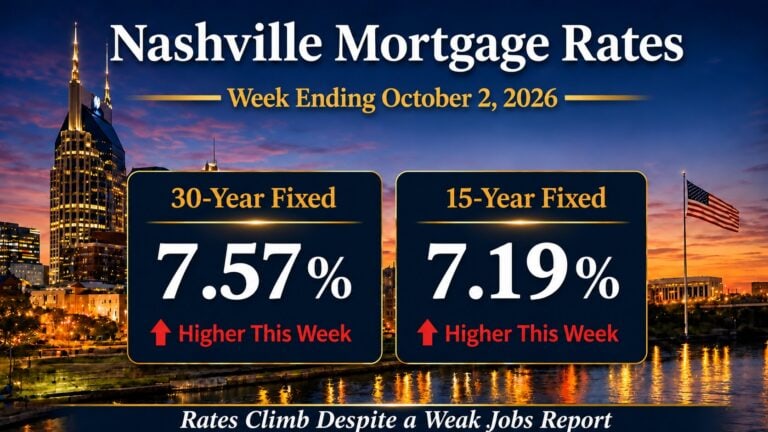
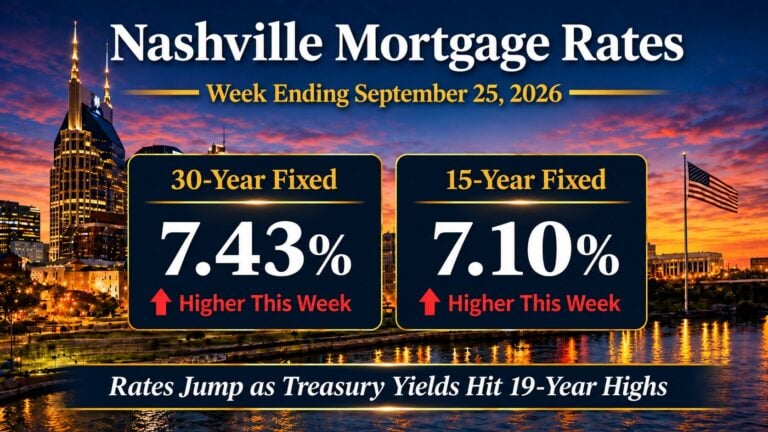
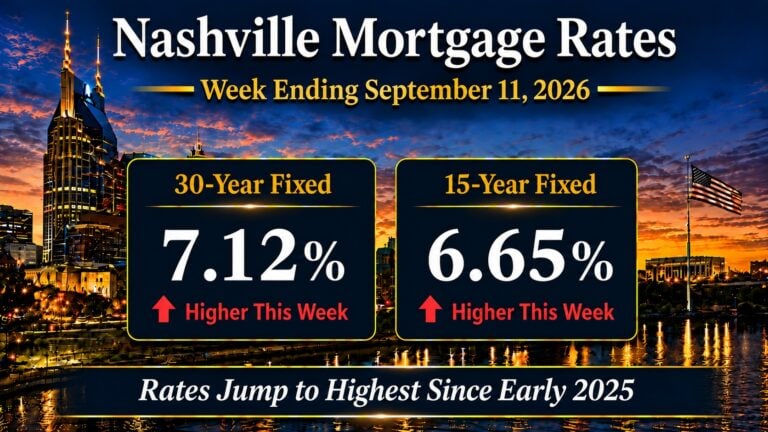
Newer report available: Nashville Mortgage Rates, Week Ending September 25, 2026.
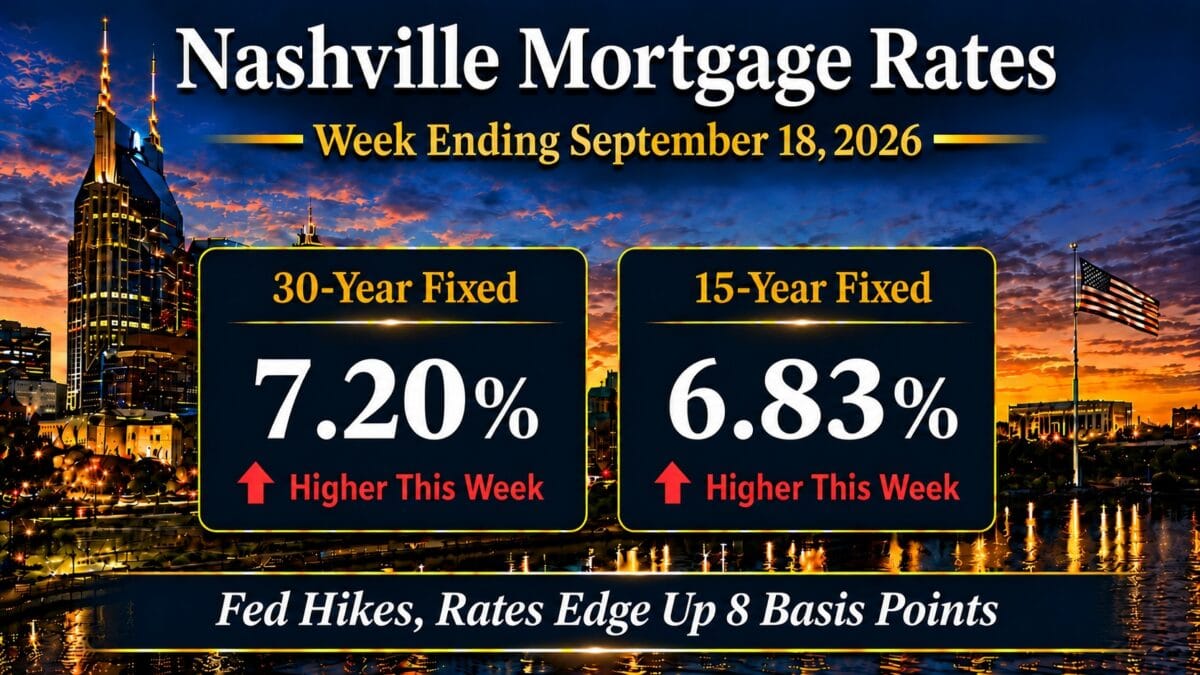
Nashville mortgage rates are 7.20% on the 30-year fixed and 6.83% on the 15-year fixed as of Friday, September 18, 2026. FHA 30-year sits at 6.81%, jumbo 30-year at 7.36%. The 30-year rose 8 basis points on the week from 7.12%, the 15-year 18 basis points from 6.65%. These are Friday closes from the Mortgage News Daily Rate Index, which prices lender rate sheets rather than a survey.
The Federal Reserve raised its target range a quarter point on Wednesday, September 16, 2026, to 3.75% to 4.00%. Mortgage rates finished the week 8 basis points higher. Those 2 facts belong together. Most of the calls I took assumed the first causes the second, and it does not.
What I am watching is the gap between the 2 markets. The 10-year Treasury closed at 5.01%, above the 5.00% level I flagged as the pivot last week. Yet the mortgage market took a rate hike and a hawkish press conference in stride. That is calmer than the week deserved, and it shows where the pressure sits.
In this report
Market Summary
- Nashville mortgage rates closed Friday at 7.20% on the 30-year, up 8 basis points from 7.12%.
- The 15-year closed at 6.83%, up 18 basis points. The gap between the 2 terms narrowed to 37 basis points from 47.
- FHA 30-year closed Friday at 6.81%, up 13 basis points. Jumbo 30-year closed at 7.36%, up 11 basis points.
- The 10-year Treasury closed Friday at 5.01%, up 5 basis points from 4.96%, per the official Treasury constant maturity series.
- The Federal Open Market Committee raised the federal funds target range a quarter point to 3.75% to 4.00% on September 16, 2026, by a 12 to 0 vote.
- The weekly high was 7.24% on Wednesday, the day of the Fed decision. Thursday gave back 5 basis points to 7.19%; Friday added 1.
- The Freddie Mac survey published Thursday, September 17 averaged 6.95% on the 30-year and 6.26% on the 15-year, up 19 and 17 basis points.
- Core CPI, which strips food and energy, rose 2.4% over the 12 months ending August 2026, down from 2.5%, per the September 11, 2026 release.
The live weekly rate tracker carries the running series between these Friday posts.
Mortgage Rate Dashboard
The mortgage rate dashboard shows a 7.20% 30-year fixed rate, a 6.83% 15-year fixed rate, an FHA 30-year rate near 6.81%, a 10-year Treasury yield near 5.01%, and a mortgage spread near 2.19%, as of the week ending September 18, 2026. That 2.19% pairs the Friday mortgage close with the Friday Treasury close. The weekly-average measure runs lower and is covered below.
Nashville Mortgage Rates This Week
How did the week actually unfold?
Monday and Tuesday drifted higher on nothing in particular, 7.17% then 7.22%. Wednesday brought the Fed decision and the weekly high of 7.24%. Thursday reversed most of that to 7.19%. Friday added a single basis point to close at 7.20%. The prior week ran 23 basis points in one direction. This was a quiet week with one loud afternoon in it.
The 10-year Treasury tells the same story with cleaner edges. It opened Monday at 4.97%, touched 5.01% Wednesday, fell to 4.94% Thursday, then closed Friday back at 5.01%. Two visits to 5.01% with a dip between them is not a trend. It is a level being tested.
What did the Fed actually do?
The Committee raised the target range a quarter point, to 3.75% to 4.00%, on a 12 to 0 vote. Note that this is a range, not a single rate. The distinction matters when coverage quotes one number. The statement called economic activity solid and inflation elevated.
Institutional Macro Snapshot
What Is Driving Mortgage Rates Right Now?
Why did a rate hike barely move mortgage rates?
Because the hike was priced in weeks ago. Markets account for an expected Fed move well before it lands. By Wednesday afternoon the decision itself carried almost no new information. The bond market barely reacted when the statement hit at 1:00 p.m. Central. This is the most useful thing a borrower can understand about Fed weeks, and I explain it constantly.
The federal funds rate governs overnight lending between banks. Nashville mortgage rates do not key off it. Your 30-year mortgage is priced off the 10-year Treasury and the mortgage-backed securities market. Both trade on expectations of inflation and growth over the next decade. The 2 can and often do move in opposite directions.
What did Chair Warsh signal?
Rates started climbing about 30 minutes after the decision, when Chair Kevin Warsh began his press conference. He called the move removing some accommodation. That word “some” did the damage. It implies the Committee still sees policy as supporting growth rather than restraining it. Further hikes are therefore on the table. He added that inflation had not improved, the economy had strengthened, and the geopolitical picture had worsened.
Longer-term rates had been looking for evidence that the Committee is serious about inflation. Wednesday delivered it. That is why the reaction came from the press conference rather than the statement.
Why did Friday give some of it back?
Thursday recovered nearly all of Wednesday’s move. Friday weakened again for reasons incidental to the main story. Currency markets were the likely driver, with Japan selling Treasuries to support the yen. I would not read a policy signal into Friday. When a move has a mechanical explanation, that is usually the right one.
The 10-Year Treasury and Mortgage Rate Spreads
What does the spread say about lenders?
Measured Friday to Friday, the spread between the 30-year mortgage and the 10-year Treasury is 219 basis points, widening 3 from 216. A second measure pairs the Freddie Mac survey with the 10-year weekly average. On that basis it is 196 basis points against 187 the prior week.
That second number is the one worth your attention. Since Freddie Mac changed the survey methodology in November 2022, the spread has averaged 246 basis points. A 196 basis point spread is well inside that. Lenders are not where this week’s pain came from. Of the 8 basis points the 30-year added, 5 came from the Treasury market.
Why does 5.01% on the 10-year matter?
Because 5.00% has functioned as a ceiling rather than a waypoint. The 10-year touched it Wednesday, retreated Thursday, and closed there Friday. A yield that tests a level twice and holds is building a base, not spiking. If it breaks above, the 30-year follows within days, and every payment figure below moves with it.
Payment Impact for Nashville Buyers
Here is what Nashville mortgage rates cost in practice. On a $400,000 loan at Friday’s 7.20% close, 30-year fixed, principal and interest run $2,715 per month. The same loan on a 15-year at 6.83% runs $3,557. That is $842 more a month, and it saves $337,122 in lifetime interest. The 37 basis point gap between the 2 terms is the narrowest in several weeks. That strengthens the case for the shorter term if the monthly figure works.
At 7.20%, principal and interest run $2,036 on a $300,000 loan; $2,715 on $400,000; $3,394 on $500,000. On $600,000 it is $4,073; on $750,000, $5,091. Each quarter point of rate movement is worth about $17 per month for every $100,000 borrowed. These figures exclude taxes, insurance and HOA dues. Dues matter in the FHA-approved condo buildings, where they can exceed the tax line.
Strategic Borrower Considerations in Today’s Market
What am I telling clients this week?
A 2-1 buydown on a $500,000 loan at 7.20% drops the first-year payment to $2,746 and the second year to $3,062. The full payment is $3,394. That is $648 a month of relief in year one and $332 in year two, or $11,760 total. In my 25 years working Middle Tennessee, seller-paid buydowns get easier to negotiate in this kind of week. Listings sit, and sellers would rather solve a payment problem than cut a price.
For investors, the arithmetic has moved further against leverage. Coverage math on DSCR loans for Nashville short-term rentals needs rerunning at current pricing, not July’s numbers. I would rather rerun it now than at the appraisal.
Nashville Real Estate Market Outlook
What am I watching into October?
The calendar ahead is busy but light on market-moving releases. Oil prices are as likely as anything to set the daily tone. 3 dates matter. The September employment report lands Friday, October 2, 2026. September CPI follows Wednesday, October 14. The next Fed meeting is October 27 and 28. It carries no updated projections, which removes one source of volatility.
My read is that the 5.00% level on the 10-year decides the next month, not the Fed. If buyers show up for Treasuries in the low fives, Nashville mortgage rates settle into the low sevens and inventory keeps clearing slowly. If they do not, the 30-year sees 7.50% before it sees 6.75%. East Nashville’s entry tiers are where I expect that pressure first. That is where the payment math is tightest.
Nashville Mortgage Rates FAQ
What are Nashville mortgage rates today?
As of the Friday, September 18, 2026 close, the 30-year fixed was 7.20%, the 15-year fixed was 6.83%, the FHA 30-year was 6.81% and the jumbo 30-year was 7.36%, per the Mortgage News Daily Rate Index. The Freddie Mac weekly survey published September 17, 2026 averaged 6.95% on the 30-year and 6.26% on the 15-year. Your actual quote will differ based on credit score, loan size, property type, occupancy and lock period.
Did the Fed rate hike raise Nashville mortgage rates?
Only indirectly, and less than most people expect. The Federal Open Market Committee raised its target range a quarter point to 3.75% to 4.00% on September 16, 2026, and the 30-year fixed finished that week 8 basis points higher at 7.20%, per the Mortgage News Daily Rate Index. The decision itself moved the bond market very little because it was already priced in. The increase came after the press conference, when Chair Kevin Warsh signaled that further hikes remain possible.
Did Nashville mortgage rates go up or down this week?
Up, modestly. The 30-year rose 8 basis points from 7.12% on Friday September 11 to 7.20% on Friday September 18, 2026. The 15-year rose 18 basis points from 6.65% to 6.83%. The weekly high was 7.24% on Wednesday, the day of the Fed decision, per the Mortgage News Daily Rate Index dated history table.
What is the mortgage spread and why does it matter in Nashville?
The mortgage spread is the gap between the 30-year mortgage rate and the 10-year Treasury yield. On the weekly-average basis, pairing the Freddie Mac survey for the week of September 17, 2026 with the 10-year Treasury weekly average, it is 196 basis points, against 187 the prior week. Since Freddie Mac changed its survey methodology in November 2022, that spread has averaged 246 basis points, so the current reading sits well inside the post-2022 range. It matters because it is the second lever on your rate, and right now it is not the one working against you.
What is the monthly payment on a $500,000 Nashville home right now?
Take a $400,000 loan on a 30-year fixed with 20% down. At Friday’s 7.20% close on September 18, 2026, per the Mortgage News Daily Rate Index, principal and interest run $2,715 per month, excluding property taxes, homeowners insurance and any HOA dues. On a $500,000 loan at the same rate, principal and interest run $3,394 per month.
Should I wait for rates to fall before buying in Nashville?
That depends on whether the 10-year Treasury holds 5.00%, where it closed on September 18, 2026. A quarter point of rate movement changes the payment by roughly $17 per month for every $100,000 borrowed, so on a $400,000 loan a half point is about $134 a month. Weigh that against the price and competition you face today. A 2-1 buydown on a $500,000 loan currently delivers $11,760 of total payment relief, which in many cases outweighs the improvement a borrower is waiting for.
Sources, methodology, and disclosure
Rates are Friday, September 18, 2026 closes from the Mortgage News Daily Rate Index, read from its dated history tables. The 10-year is the official U.S. Treasury constant maturity yield from the Treasury’s Daily Par Yield Curve for Friday, September 18, 2026. Week-over-week comparisons are Friday to Friday for every instrument. Two spread measures appear above and they are not interchangeable: the 219 basis point figure pairs the Friday mortgage close with the Friday Treasury close, and the 196 basis point figure pairs the Freddie Mac survey with the 10-year Treasury weekly average for the same week, which is the basis on which the 246 basis point post-2022 average is computed. Freddie Mac figures are the Primary Mortgage Market Survey released September 17, 2026. Inflation figures are the Bureau of Labor Statistics CPI release for August 2026, published September 11, 2026. The federal funds target range is from the Federal Reserve’s September 16, 2026 statement. Payment figures use the standard amortization formula, principal and interest only. Daily driver attribution follows Mortgage News Daily’s Mortgage Rate Watch commentary for the week ending September 18, 2026.
Broker fees are not set by law and are fully negotiable. Commission and buyer-agency terms should be discussed before contract. Mortgage rates change daily and lender quotes differ by credit profile, loan size, property type and lock period. Nothing here is a rate lock guarantee, a commitment to lend, or investment advice. Forward-looking observations reflect conditions as of September 18, 2026 and are subject to change.
More Nashville mortgage analysis
- Last week’s rate update, the week the 30-year jumped 23 basis points.
- The live weekly rate tracker, updated between these posts.
- Mortgage Rates and Financing archive, every weekly update.
- FHA-approved Nashville condo buildings.