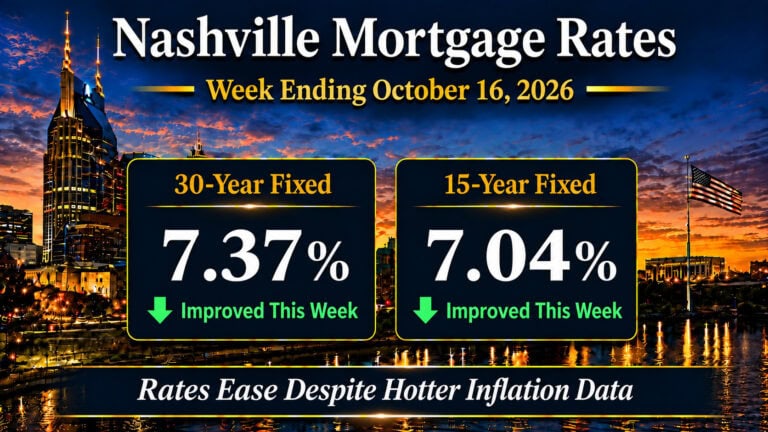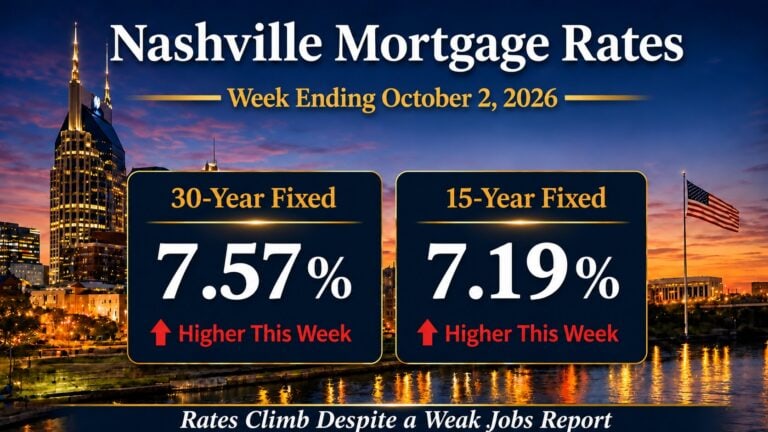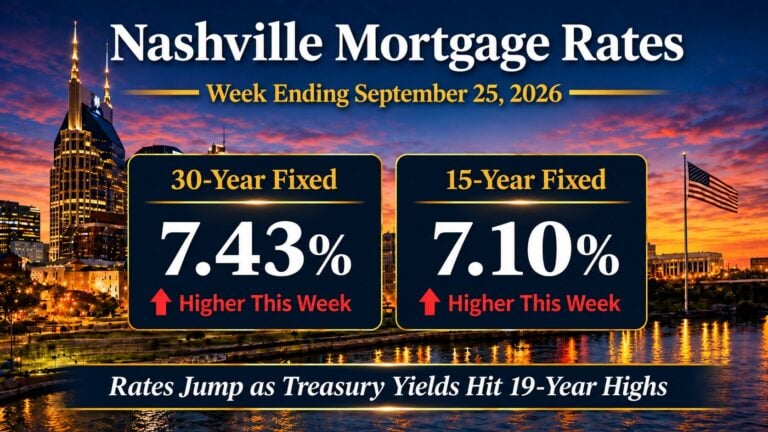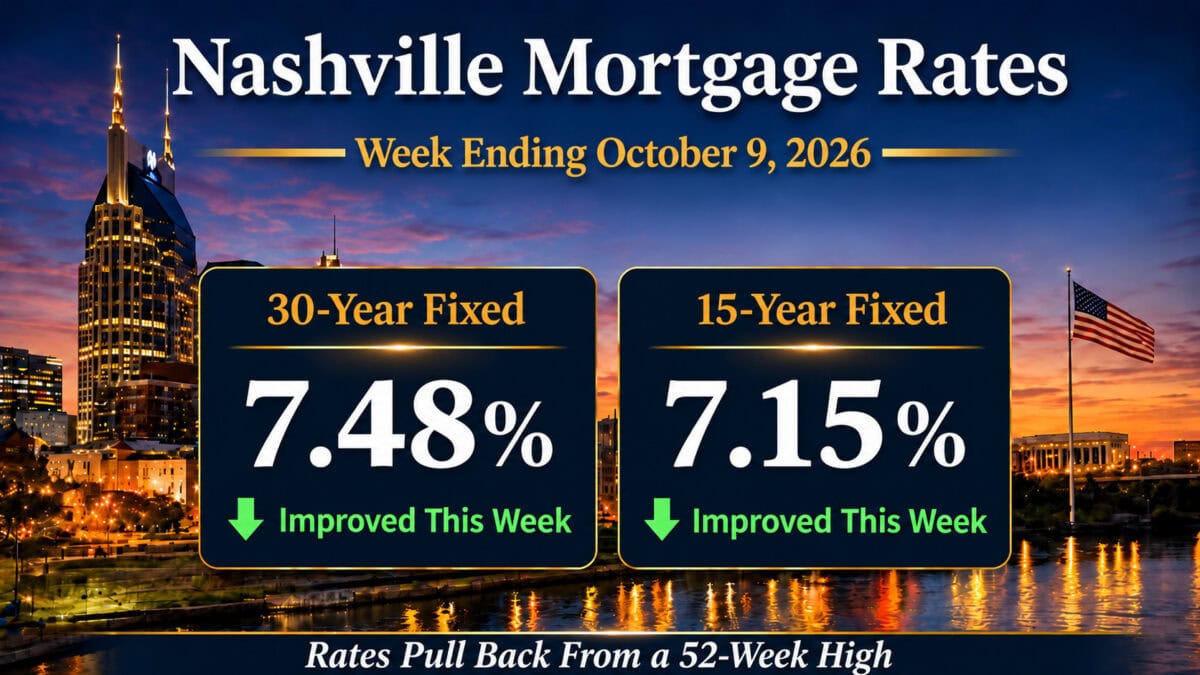
Nashville mortgage rates ended the week ending October 9, 2026 at 7.48% on the 30-year fixed, down 9 basis points from 7.57% a week earlier. The 15-year fixed finished at 7.15%, down 4 basis points. FHA 30-year financing sits near 7.15% and jumbo near 7.63%. On Freddie Mac’s weekly survey the 30-year sits at 7.40% against 6.30% a year ago, so borrowing costs are 110 basis points higher than last October.
The weekly number hides the shape of the week. Monday printed 7.61%, the top of the 52-week range. Thursday brought the largest single-day drop in 3 months, 9 basis points, and Friday added another 2. The whole week traded inside a 13-basis-point band. So this is a spike that reversed rather than a quiet decline, and two-week lows are not a recovery.
Here is what I am watching. Freddie Mac’s survey printed 7.40% Thursday, up 12 basis points and the highest reading in its own 52-week range, because its window closed before Thursday’s rally. Two instruments, two directions, one week, and both are correct. When those two disagree I trust the daily index, and right now it is the one saying the pressure eased.
In this report
Market Summary
- 30-year fixed: 7.48%, down 9 basis points from 7.57% the prior Friday (Mortgage News Daily daily index, October 9, 2026).
- 15-year fixed: 7.15%, down 4 basis points from 7.19% the prior Friday (Mortgage News Daily, October 9, 2026).
- FHA 30-year: 7.15% (Mortgage News Daily, October 9, 2026). On a condo the building has to be FHA approved too.
- Jumbo 30-year: 7.63% (Mortgage News Daily, October 9, 2026).
- Freddie Mac PMMS 30-year: 7.40%, up 12 basis points from 7.28% (survey week ending October 8, 2026). A year ago the same survey read 6.30%, so the 30-year is 110 basis points higher than it was on October 9, 2025.
- Freddie Mac PMMS 15-year: 6.73%, up 13 basis points from 6.60% (October 8, 2026). A year ago, 5.53%, so 120 basis points higher.
- 10-year Treasury: 5.24%, down 4 basis points from 5.28% the prior Friday (U.S. Treasury daily par yield curve, October 9, 2026). The week’s high was 5.31% on October 5.
Freddie Mac publishes every Thursday at noon Eastern: Primary Mortgage Market Survey.
Mortgage Rate Dashboard
The mortgage rate dashboard shows a 7.48% 30-year fixed rate, a 7.15% 15-year fixed rate, an FHA 30-year rate near 7.15%, a 10-year Treasury yield near 5.24%, and a mortgage spread near 2.24%, as of the week ending October 9, 2026. These are the numbers I price against. Every figure is dated Friday, October 9, and the dashboard footer names its source.
Nashville Mortgage Rates This Week
Monday set a 52-week high, and then it broke
The index opened Monday at 7.61%, the top of its 52-week range and the fourth straight week of setting or matching a high. Tuesday eased to 7.56%. Wednesday opened much higher and recovered nearly all of it, closing at 7.59%. The Fed released its September 15-16 minutes on October 7, and the bond market had already priced them.
Thursday did the work
Thursday the index fell 9 basis points to 7.50%, its largest one-day move lower in 3 months. Mortgage News Daily credits buyers stepping back into bonds once yields looked high enough, not any single event. That distinction is the part I care about. A rally on a data surprise has a cause you can watch repeat; a rally on yields merely looking cheap has no schedule and can unwind just as quietly. Friday slipped 2 more to 7.48%, a two-week low.
Institutional Macro Snapshot
What Is Driving Mortgage Rates Right Now?
The Treasury auctions did the work, not the data calendar
No top-tier economic report landed this week. September’s jobs report came October 2 and September CPI does not arrive until Wednesday, October 14. The supply calendar was the event instead: Treasury auctioned 10-year notes Tuesday and 30-year bonds Wednesday, and 10-year demand was reported strong. Mortgage News Daily also credits headlines around the Iran war. Neither explains the whole move, and MND says as much.
The old line is that the cure for high rates is high rates. Once a yield gets high enough, buyers come back, and that is what stops the bleeding. I treat a supply-driven recovery as less durable than a data-driven one, because the next auction has to clear too.
Wednesday is the tell, not Thursday
Thursday was the big number, but Wednesday is the one I keep going back to. Rates opened at new long-term highs and gave almost all of it back by afternoon, the third time this run a push to new highs was bought rather than extended. Mortgage News Daily reads those repeated recoveries from 10-year yields above 5.30% as early evidence of a ceiling. I would be slower: every prior reversal like this needed help from the data to hold.
The September FOMC minutes landed Wednesday
The Federal Reserve published the minutes of its September 15-16 meeting on October 7. The next scheduled FOMC meeting is October 27-28, 2026, and it does not carry a Summary of Economic Projections. The December 8-9 meeting does.
Why the survey says up and the index says down
Freddie Mac’s survey rose 12 basis points this week while the daily index fell 9. Both are right. The survey collects through Wednesday and publishes Thursday at noon, so it caught the week’s high and missed the reversal entirely. That is why I put both on the page: a weekly survey is describing a market that can be three days stale, and in a week like this one it points the wrong way.
The 10-Year Treasury and Mortgage Rate Spreads
The 10-year closed Friday at 5.24%, down 4 basis points from 5.28% the prior Friday, after reaching 5.31% Monday. Against the 30-year at 7.48%, that puts the mortgage spread at 224 basis points.
That gap between the mortgage and the Treasury is the part most coverage gets wrong. Measured on Freddie Mac’s weekly survey instead, the basis behind its post-2022 average of about 246 basis points, the spread settled at 202 basis points for the week ending October 2 (a 7.28% survey rate less a 5.26% 10-year weekly average), still well below that average. The spread is not what is hurting you right now. The Treasury yield is. If you are waiting for lenders to narrow their margins, you are waiting on the wrong number.
Payment Impact for Nashville Buyers
Find your purchase price and read across. Principal and interest only at 7.48%, the October 9, 2026 rate, assuming 20% down. Taxes, insurance and any HOA dues sit on top of these figures.
This week’s 9-basis-point improvement is worth roughly $6 per $100,000 borrowed: real, but small. A half-point move is worth about $34 per $100,000, which is the number to keep in your head when you are deciding whether to wait. The East Nashville pricing tiers show how far one neighborhood spans those rows.
The 15-year costs more monthly and far less in total
On the same $400,000 loan the 15-year runs $3,629 against $2,791, a difference of $838 a month. Lifetime interest is $253,209 against $604,898, a saving of $351,688. But the rate gap between the terms is only 0.33%. You are buying that saving almost entirely with payment, not with a discount, and at this gap I would rather see the cash in reserves.
Strategic Borrower Considerations in Today’s Market
If you are closing inside 30 days, I would lock, and I would call your lender today. CPI lands Wednesday and PPI Thursday, and a 13-basis-point weekly range is not enough upside to risk a hot print against. If you are 60 days or further out, ask your lender whether a float-down is available and what it costs, then float and watch 5.30% on the 10-year. That is the whole decision this week.
Ask the seller for a 2-1 buydown before you ask for a price cut. On a $500,000 loan at 7.48%, full payment is $3,489. Year one at 5.48% is $2,833, year two at 6.48% is $3,154. Total relief is $11,904, funded by a seller credit. In 550-plus short-term rental transactions I have found sellers will fund a buydown before cutting price by the same dollars, because the credit does not reset their comparable sales. Same money to them, bigger first-year difference to you. On an income property, DSCR financing qualifies off the property rather than your returns.
On a refinance, most of you should not be. If you are sitting on a rate in the 5s or low 6s, nothing that happened this week changes that, and a 13-basis-point range is not the start of a refinance window. The conversations worth having right now are narrower: an ARM about to reset, a HELOC you want to term out, or a cash-out where the use of the money justifies paying 7.48% on it. Run the break-even before any of them. The number I ask a lender for is the month the savings cross the cost, in writing.
Nashville Real Estate Market Outlook
September CPI lands Wednesday, October 14, 2026 at 8:30am Eastern, PPI Thursday, October 15. Bond markets are closed Monday, October 12 for Columbus Day, so the week starts Tuesday. Those two reports cut both ways: softer readings give this week a foundation and ease pressure on the Fed to keep hiking, hotter readings put the highs back in play. Note the direction of that sentence. The live debate, and the one I am planning around, is whether the Fed hikes again, not when it cuts.
The level I am watching is 5.30% on the 10-year Treasury. Yields have now been turned back from above it more than once, and if that keeps happening it is the closest thing to a ceiling this market has offered. On the mortgage side the week’s low was 7.48%, so a close below 7.40% would be the first genuine lower low of this run, and a move back above Monday’s 7.61% would say the ceiling thesis is wrong. I update the weekly rate tracker every Friday.
Nashville Mortgage Rates FAQ
What is the current 30-year mortgage rate in Nashville?
The 30-year fixed rate was 7.48% on October 9, 2026, per the Mortgage News Daily daily rate index. Freddie Mac’s Primary Mortgage Market Survey, released October 8, 2026, put the national 30-year average at 7.40%.
Did Nashville mortgage rates go up or down this week?
Down. The 30-year fixed fell 9 basis points, from 7.57% on October 2, 2026 to 7.48% on October 9, 2026, per Mortgage News Daily. The week’s high was 7.61% on October 5, 2026.
How much higher are mortgage rates than a year ago?
110 basis points on the 30-year. Freddie Mac’s survey read 6.30% on October 9, 2025 and 7.40% on October 8, 2026. The 15-year is 120 basis points higher, 5.53% to 6.73%.
What is the monthly payment on a $400,000 mortgage right now?
About $2,791 in principal and interest on a 30-year fixed at 7.48%, the October 9, 2026 rate. Property taxes, insurance and any HOA dues are additional.
What is the mortgage spread over the 10-year Treasury?
224 basis points on October 9, 2026: the 7.48% 30-year index less the 5.24% 10-year Treasury, both dated that Friday. That is 5 basis points narrower than the prior Friday. The post-2022 average of about 246 basis points is measured on Freddie Mac’s weekly survey basis, where the spread settled at 202 basis points for the week ending October 2, so lender margins remain inside their norm.
What could move mortgage rates next week?
September CPI on Wednesday, October 14, 2026 and September PPI on Thursday, October 15, 2026, both at 8:30am Eastern per the Bureau of Labor Statistics release calendar. The next Federal Reserve meeting is October 27-28, 2026.
Sources, Methodology, and Disclosure
- Mortgage News Daily, daily rate index dated history tables, read October 9, 2026 (
og:last_updated 2026-10-09T20:43Z). - Mortgage News Daily, Mortgage Rate Watch, daily commentary October 5 through October 9, 2026, including the October 9 weekly wrap.
- Freddie Mac Primary Mortgage Market Survey, release dated October 8, 2026.
- U.S. Department of the Treasury, Daily Treasury Par Yield Curve Rates, October 2026.
- U.S. Department of the Treasury, 10-year note auction of October 7, 2026 and 30-year bond auction of October 8, 2026.
- Federal Reserve Board, FOMC calendar and the September 15-16, 2026 minutes released October 7, 2026.
- U.S. Bureau of Labor Statistics, 2026 release schedule.
Rates shown are the Mortgage News Daily daily rate index and the Freddie Mac Primary Mortgage Market Survey as dated above, and are national survey and index figures, not a quote. Your rate depends on credit, loan-to-value, property type, occupancy and lock period. Payment figures are principal and interest only.
Forward-looking statements in this post reflect current data, cited forecasts, and the BDG Partners team’s interpretation of market conditions as of October 9, 2026. Future performance may differ materially. This is not investment advice. Grant Hammond is a Tennessee-licensed broker (#281540) at Compass RE.
Broker fees are not set by law and are fully negotiable.