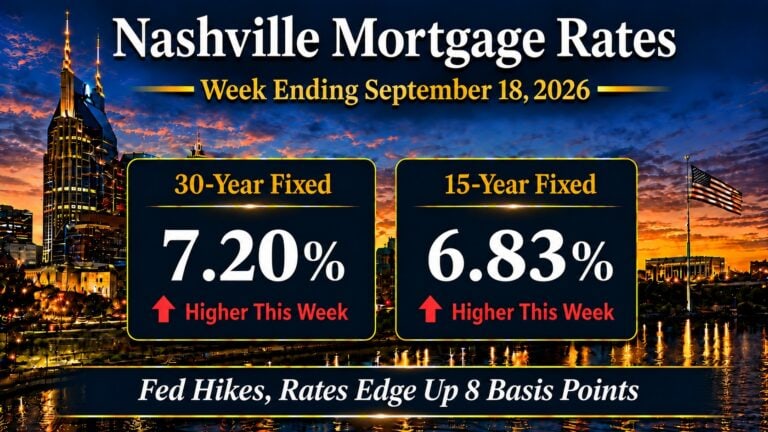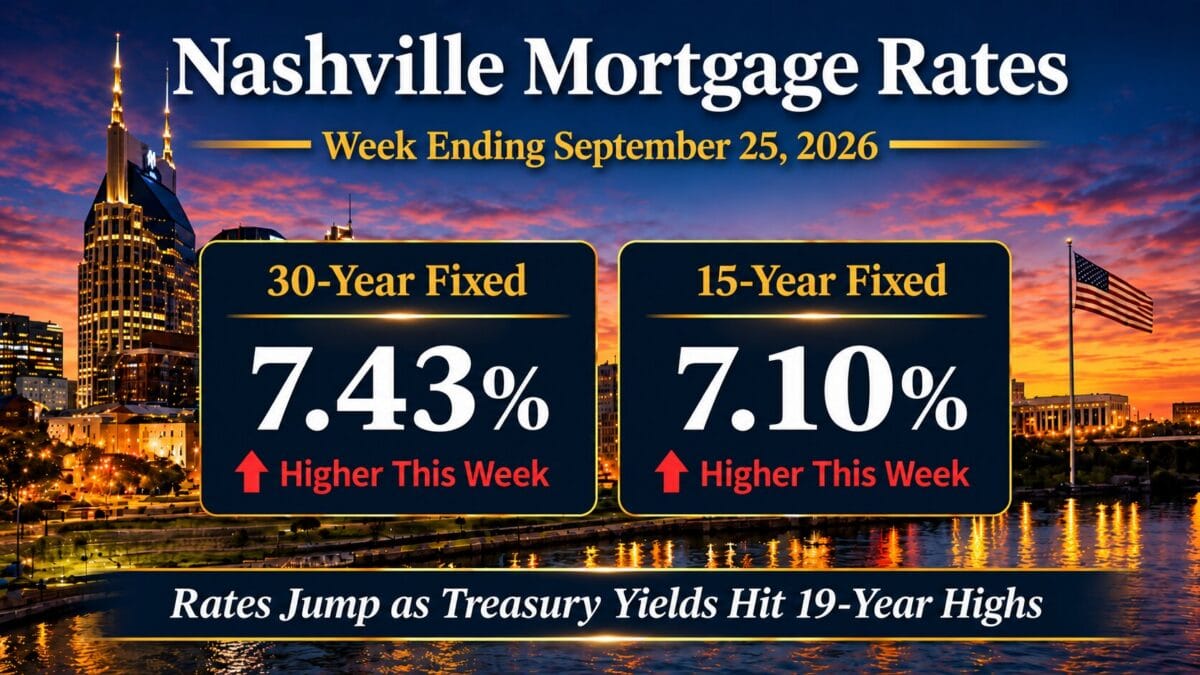
Nashville mortgage rates are 7.43% on the 30-year fixed and 7.10% on the 15-year fixed as of Friday, September 25, 2026. FHA 30-year sits at 7.15%, jumbo 30-year at 7.55%. The 30-year rose 23 basis points on the week from 7.20%, and the 15-year rose 27 basis points from 6.83%. These are Friday closes from the Mortgage News Daily Rate Index, which prices lender rate sheets rather than a survey.
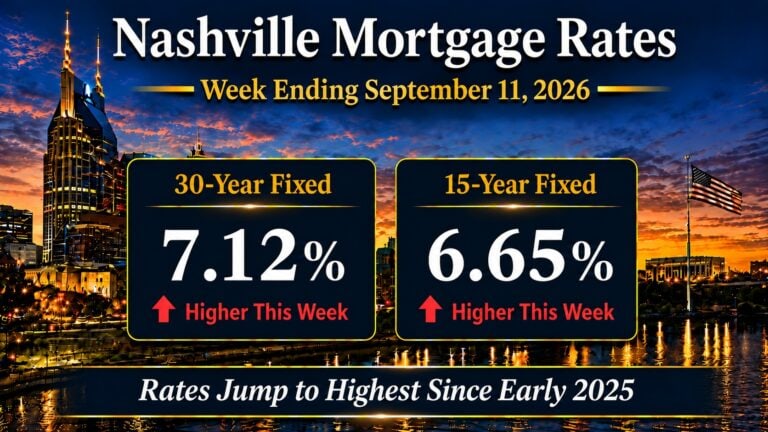
That ties the week ending September 11 as the sharpest week of 2026. The 30-year is 104 basis points above where it stood a year ago. Almost all of the damage landed in 2 sessions, Wednesday and Thursday, and it came out of the Treasury market rather than out of lender margins.
Here is the gap I want you to see. The Federal Reserve raised rates on September 16 and the market shrugged. The week after, it did not. What changed was not policy. It was the price traders are willing to pay to hold a 10-year note, and that is the number I am watching into October.
In this report
Market Summary
- Nashville mortgage rates closed Friday at 7.43% on the 30-year, up 23 basis points from 7.20%.
- The 15-year closed at 7.10%, up 27 basis points from 6.83%. The gap between the 2 terms narrowed to 33 basis points from 37.
- FHA 30-year closed Friday at 7.15%, up 34 basis points. Jumbo 30-year closed at 7.55%, up 19 basis points.
- The week’s path ran 7.19% Monday, 7.17% Tuesday, 7.26% Wednesday, 7.45% Thursday and 7.43% Friday. Wednesday and Thursday together added 28 basis points; Friday gave 2 back.
- Thursday’s 7.45% is the highest print in the 52-week range, whose low is 5.99%. The 15-year’s Friday close of 7.10% is itself the top of a range whose low is 5.55%.
- The daily index first crossed 7.00% on September 10, 2026, at 7.07%, and has closed above it every session since.
- The 10-year Treasury constant maturity yield closed Friday at 5.17%, up 16 basis points from 5.01%. Thursday’s 5.18% was the highest since 2007.
- The Freddie Mac Primary Mortgage Market Survey published Thursday, September 24 averaged 7.03% on the 30-year and 6.42% on the 15-year, up 8 and 16 basis points.
- The federal funds target range is 3.75% to 4.00%, unchanged this week and last raised on September 16, 2026.
- Core CPI, which strips food and energy, rose 2.4% over the 12 months ending August 2026, down from 2.5%, per the September 2026 release.
The live weekly rate tracker carries the running series between these Friday posts.
Mortgage Rate Dashboard
The mortgage rate dashboard shows a 7.43% 30-year fixed rate, a 7.10% 15-year fixed rate, an FHA 30-year rate near 7.15%, a 10-year Treasury yield near 5.17%, and a mortgage spread near 2.26%, as of the week ending September 25, 2026. That 2.26% pairs the Friday mortgage close with the Friday Treasury close. The weekly-average measure runs lower and is covered below.
Nashville Mortgage Rates This Week
How did the week actually unfold?
Monday and Tuesday were quiet, 7.19% then 7.17%. Wednesday broke the calm with a 9 basis point rise to 7.26% as bonds sold off hard. Thursday was worse and added 19 basis points to 7.45%. Friday gave 2 back to close at 7.43%. Two sessions produced the entire move and more.
The 10-year Treasury drove it. The constant maturity yield sat at 4.96% Monday and Tuesday, jumped to 5.11% Wednesday, then to 5.18% Thursday. That is 22 basis points in 2 days on the instrument your mortgage is priced against. Friday it eased a single basis point to 5.17%.
Was Friday a recovery?
It was a pause, and I would not call it more than that. The bond market improved on Friday and lender sheets followed it down by 2 basis points. One session does not undo 28. What Friday did tell us is that the selling found a buyer, which after 2 days like those is worth knowing.
Institutional Macro Snapshot
What Is Driving Mortgage Rates Right Now?
What actually happened on Wednesday?
4 things landed on the bond market in one session, and they all pushed the same way.
It started with Fed Governor Michael Barr raising the prospect of further policy adjustments to bring inflation back to the 2% target. Then the September flash PMI came in far stronger than forecast: the composite at 58.4 against 56.0 in August, manufacturing at 57.0 against a 53.6 consensus, services at 58.7 against 56.0. Then the Treasury sold $70 billion of 5-year notes at a high yield of 5.033% and demand was thin. Oil firmed on Iran uncertainty and the yen weakened.
The 10-year constant maturity yield closed Wednesday at 5.11%, up 15 basis points in a session. Thursday added 7 more to 5.18%, the highest since 2007.
Why is strong data bad news here?
Because a hot economy gives the Committee more reason to keep raising. That is the whole mechanism, and I find myself explaining it most weeks. The economy running well is good news for your business and bad news for your rate, in the same week, from the same report. A $70 billion auction that struggles to find buyers says the same thing in a different language.
Did Friday change anything?
Only at the margin, and I would not read too much into one session. The bond market improved as oil fell on reports that United States and Iran talks had reached a technical stage, and the 30-year eased 2 basis points. Consumer sentiment at 48.1 beat the 47.6 expected, durable goods were flat against a forecast decline, and jobless claims came in at 197,000 against 201,000 expected. Nothing in that says slowing.
Why does 5.00% on the 10-year matter so much?
Because for 19 years it has been the ceiling. Every approach to 5.00% since 2007 has marked roughly the worst rates got before yields came back down. The question now is not whether the 10-year can poke above it for a day. It is whether it can settle there. If it does, a level that has acted as the ceiling starts acting as the floor, and the range every one of us has been quoting from resets upward.
The 10-Year Treasury and Mortgage Rate Spreads
What does the spread say about lenders?
Measured Friday to Friday, the spread between the 30-year mortgage and the 10-year Treasury is 226 basis points, widening 7 from 219. A second measure pairs the Freddie Mac survey with the 10-year weekly average. On that basis it is 195 basis points against 196 the prior week, essentially flat.
That second number is the one worth your attention. Since Freddie Mac changed the PMMS methodology in November 2022 the spread has averaged 246 basis points. The current reading sits inside that range. Lenders are not the problem this week. 16 of the 23 basis points the 30-year added came straight from the Treasury market.
What should a Nashville buyer take from that?
My advice is to plan against the rate in front of you, not the one in a forecast. For 2 years the argument for waiting has rested on a return to the 6s. A 10-year at 5.17% makes that a longer wait than most buyers have been told, and the sellers negotiating today are not going to be negotiating like this once rates ease.
One practical note for anyone quoting a payment this week. The headline you are reading is probably the Freddie Mac survey at 7.03%, which averages a window ending Wednesday and runs a step behind. The daily index closed Friday at 7.43%. Quote the daily number, or your buyer budgets off a rate that no longer exists.
Payment Impact for Nashville Buyers
Here is what Nashville mortgage rates cost in practice. On a $400,000 loan at Friday’s 7.43% close, 30-year fixed, principal and interest run $2,778 per month. On a $750,000 loan the figure is $5,208. Each quarter point of rate movement is worth about $17 per month for every $100,000 borrowed, so a week that moves 23 basis points is worth real money on a Nashville-sized loan.
The same $400,000 loan on a 15-year at 7.10% runs $3,618. That is $840 more a month than the 30-year, and it saves $348,787 in lifetime interest. The gap between the 2 terms narrowed to 33 basis points this week from 37, which is the narrowest I have seen it this year and strengthens the case for the shorter term.
At 7.43%, monthly principal and interest run $2,083 on a $300,000 loan, $2,778 on a $400,000 loan, $3,472 on a $500,000 loan, $4,167 on a $600,000 loan and $5,208 on a $750,000 loan. Each quarter point of rate movement is worth about $17 per month for every $100,000 borrowed. These figures exclude taxes, insurance and HOA dues. East Nashville’s entry pricing tiers are where a 23 basis point week changes the most contracts, because that is where the payment math is tightest.
Strategic Borrower Considerations in Today’s Market
What am I telling clients this week?
Buyers do not buy the rate. They buy the payment. Once the conversation moves to the monthly figure, options open that a rate conversation closes off.
Start with the buydown math, not the price-cut math. A 2-1 buydown on a $500,000 loan at 7.43% drops the first-year payment to $2,817 and the second year to $3,137, against a full payment of $3,472. That is $655 a month of relief in year one and $335 in year two, or $11,879 in total. In my 25 years working Middle Tennessee, a seller sitting on a stalled listing agrees to that faster than to an equivalent price reduction, because the reduction resets their comparable and the credit does not.
Should the term or product change?
It is worth pricing. The Mortgage News Daily index for the 7/6 SOFR ARM closed at 6.85% on Friday, September 25, 2026, against 7.43% on the 30-year fixed. Whether it is worth taking depends on how long the buyer holds the loan and how the adjustment terms are written. That is a conversation for the lender, not a rule of thumb. The same goes for the FHA route at 7.15%.
For investors the arithmetic has moved again. Coverage math on DSCR loans for Nashville short-term rentals that penciled at 7.20% may not pencil at 7.43%. I am rerunning those files now rather than at the appraisal.
Is a lock still worth taking?
In a market like this one, yes. A rate that moves 23 basis points in 5 days can move 23 more. Floating is a position, not a neutral choice. If your closing sits inside 45 days and the payment works today, I would take the certainty. Condo buyers should check dues alongside the rate, because in the FHA-approved condo buildings the dues line can exceed the tax line.
When should the lender enter the conversation?
Before the offer is written, not after the terms are set. Most of the structures above have to be built into the contract. By the time I hear the agreed terms it is usually too late to put a credit where it does the most good. If a negotiation stalls on price, that is the moment to call, because the gap can often be closed on the financing side instead.
Nashville Real Estate Market Outlook
What is on the calendar?
The stretch from September 30 to October 2 is loaded, and after a week like that one it matters more than usual. Core PCE, the inflation gauge the Committee weighs most heavily, lands Wednesday, September 30, 2026. The September employment report follows Friday, October 2. Consumer confidence, JOLTS, ADP and the ISM surveys fill the days between them.
The labor prints are the ones I am watching. Claims at 197,000 say the market is firm. If JOLTS, ADP and the October 2 report agree, the case for further hikes strengthens and the 10-year keeps working on 5.00% from above. A soft set is the only near-term thing that pulls the 30-year back under 7.25%. Further out, the September meeting minutes arrive October 7, September CPI on October 14, and the next Fed meeting is October 27 and 28 with no updated projections.
What does this mean for Nashville?
This is now a payment-driven market rather than a price-driven one. Sellers who solve the payment will transact. Sellers who wait for buyers to absorb a 7.43% rate at last spring’s price will sit. That is not a forecast about rates. It is what I expect to see in the contracts over the next 30 days.
There is a timing note worth knowing. Realtor.com’s 2026 Best Time to Buy report names the week of September 27 through October 3 as the most favorable of the year for buyers, on inventory, listing prices and competition. Here is what I want you to read in it. It scores seasonal inventory and pricing, and it deliberately excludes mortgage rates, because rates do not follow a seasonal pattern. So it is a statement about supply and competition, not a prediction that your rate improves. Those are still the conditions under which a buyer with a workable payment has the most room to negotiate.
Nashville Mortgage Rates FAQ
What are Nashville mortgage rates today?
As of the Friday, September 25, 2026 close, the 30-year fixed was 7.43%, the 15-year fixed was 7.10%, the FHA 30-year was 7.15% and the jumbo 30-year was 7.55%, per the Mortgage News Daily Rate Index. The Freddie Mac weekly survey published September 24, 2026 averaged 7.03% on the 30-year and 6.42% on the 15-year. Your actual quote will differ based on credit score, loan size, property type, occupancy and lock period.
Did Nashville mortgage rates go up or down this week?
Up sharply. The 30-year rose 23 basis points from 7.20% on Friday September 18 to 7.43% on Friday September 25, 2026, and the 15-year rose 27 basis points from 6.83% to 7.10%, per the Mortgage News Daily Rate Index. Thursday, September 24 alone accounted for 19 of those basis points, and Friday eased 2 back.
Why did mortgage rates rise so much the week of September 25, 2026?
The 10-year Treasury sold off. Its constant maturity yield went from 4.96% on Tuesday, September 22 to 5.18% on Thursday, September 24, per the U.S. Treasury Daily Par Yield Curve, the highest since 2007. Wednesday brought hawkish comments from Fed Governor Michael Barr, a September flash composite PMI of 58.4 against 56.0 in August, and weak demand at a $70 billion 5-year Treasury note auction that cleared at 5.033%. The federal funds target range itself did not change this week and remains 3.75% to 4.00% following the September 16, 2026 decision.
Are Nashville mortgage rates at a high?
At or near the top of the 52-week range. The 30-year touched 7.45% on Thursday, September 24, 2026, the highest print in a range whose low is 5.99%, and closed the week at 7.43%. The 15-year’s Friday close of 7.10% is the top of a range whose low is 5.55%, per the Mortgage News Daily Rate Index. That is a level, not a forecast, and it can move in either direction.
What is the monthly payment on a $500,000 Nashville home right now?
Take a $400,000 loan on a 30-year fixed with 20% down. At Friday’s 7.43% close on September 25, 2026, per the Mortgage News Daily Rate Index, principal and interest run $2,778 per month, excluding property taxes, homeowners insurance and any HOA dues. Borrow $500,000 at the same rate and principal and interest run $3,472 per month.
Should I choose a 15-year or 30-year mortgage in Nashville?
On a $400,000 loan at the September 25, 2026 closes of 7.43% and 7.10%, per the Mortgage News Daily Rate Index, the 30-year runs $2,778 a month and the 15-year runs $3,618, a difference of $840. The 15-year saves $348,787 in lifetime interest. With only 33 basis points separating the 2 rates, the shorter term is unusually well priced right now if the monthly figure works for you.
Should I wait for rates to fall before buying in Nashville?
A quarter point of rate movement changes the payment by roughly $17 per month for every $100,000 borrowed, so on a $400,000 loan a half point is about $134 a month. Against that, a 2-1 buydown on a $500,000 loan at the September 25, 2026 rate of 7.43% delivers $11,879 of total payment relief. The next scheduled events that can move pricing are the Core PCE release on September 30, 2026 and the employment report on October 2, 2026.
Sources, methodology, and disclosure
Mortgage rates are Friday, September 25, 2026 closes from the Mortgage News Daily Rate Index, taken from its settled dated history table. The 10-year is the U.S. Treasury constant maturity yield for the same Friday. Week-over-week comparisons are Friday to Friday throughout. The 2 spread measures above are not interchangeable: 226 basis points pairs the Friday mortgage close with the Friday Treasury close, while the weekly-average figure pairs the Freddie Mac survey with the 10-year weekly average, which is the basis on which the 246 basis point post-2022 average is computed. That weekly-average leg is 5.08%, confirmed by the Federal Reserve H.15 weekly release of September 28, 2026. Other sources: Freddie Mac Primary Mortgage Market Survey, September 24, 2026; Bureau of Labor Statistics CPI, August 2026 reference month; Federal Reserve statement, September 16, 2026; S&P Global flash PMI, September 23, 2026; U.S. Treasury auction results; the Realtor.com 2026 Best Time to Buy report; and Mortgage News Daily Mortgage Rate Watch commentary plus lender commentary supplied to the author. Payment figures are principal and interest only on a standard amortization. This recap covers the week ending September 25, 2026 and is dated to it.
Broker fees are not set by law and are fully negotiable. Commission and buyer-agency terms should be discussed before contract. Mortgage rates change daily and lender quotes differ by credit profile, loan size, property type and lock period. Nothing here is a rate lock guarantee, a commitment to lend, or investment advice. Forward-looking observations reflect conditions as of September 25, 2026 and are subject to change.
More Nashville mortgage analysis
- The live weekly rate tracker, updated between these posts.
- Mortgage Rates and Financing archive, every weekly update.
- FHA-approved Nashville condo buildings.