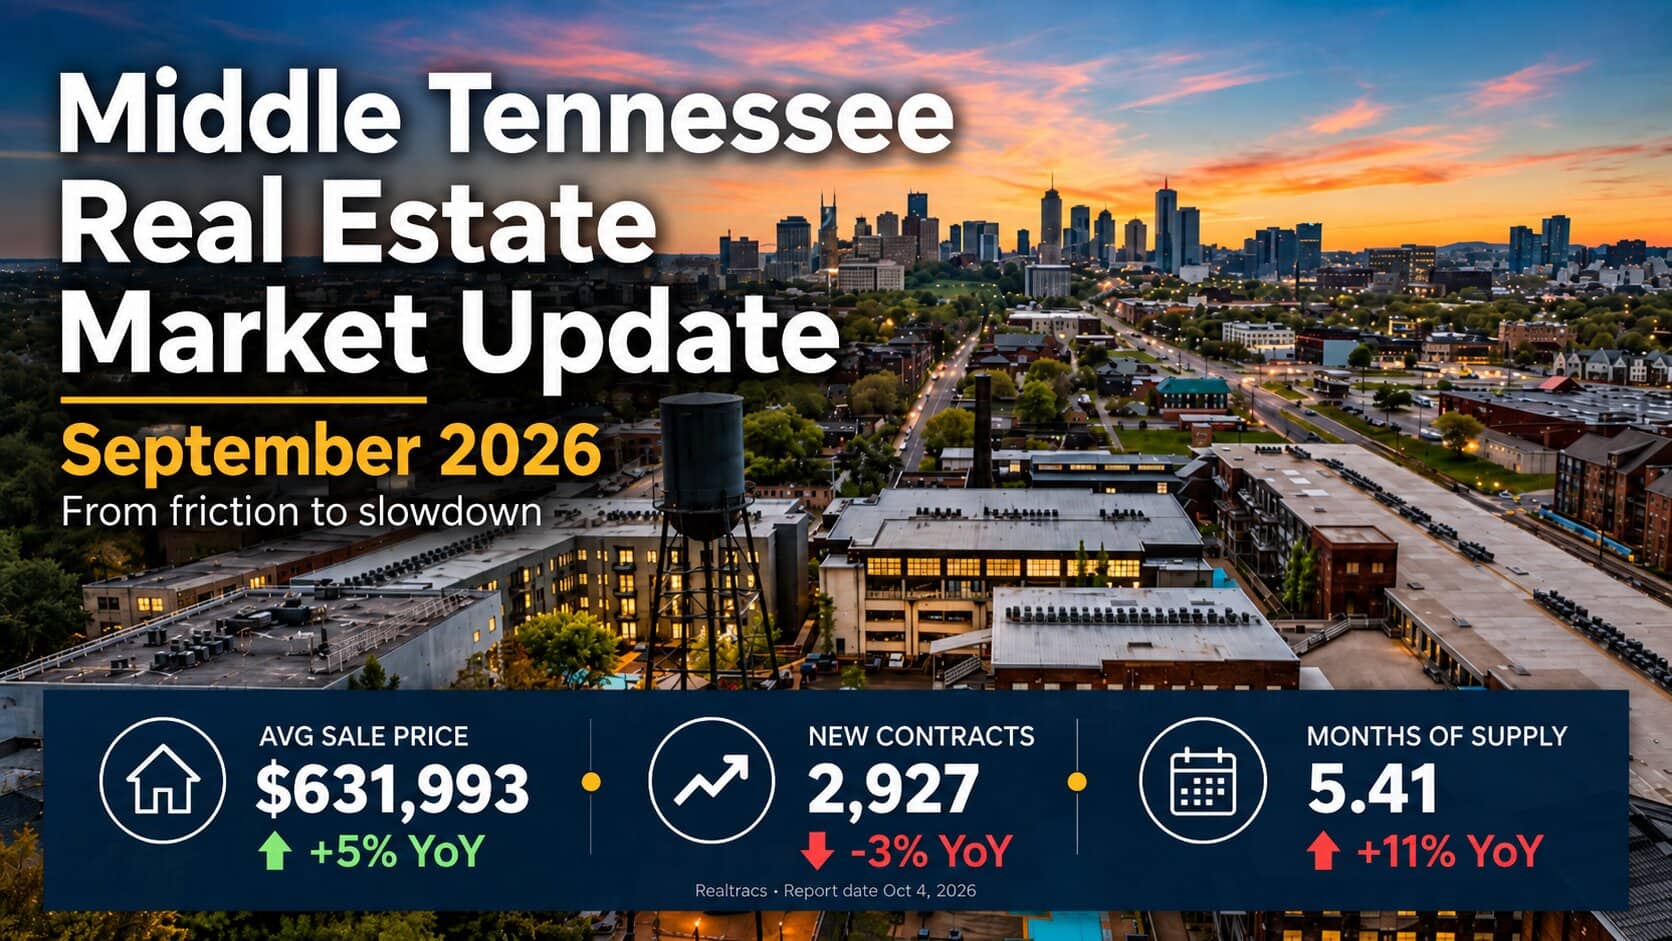
The Nashville housing market and the broader Middle Tennessee real estate market closed September 2026 with active inventory up 8% year over year to 14,249 homes, months of supply at 5.41, new contracts down 3%, and the average sale price up 5% to $631,993. The median rose 2% to $444,169.
Those year-over-year numbers read like a Nashville housing market that is holding up. The four-month trend says otherwise. Since June, new contracts have gone from growing 12% a year to shrinking. Months of supply has climbed from 4.80 to 5.41. Homes take 63 days to reach contract, up from 58 in July. And the 30-year mortgage rate went from 6.49% at the end of June to 7.28% on October 1.
I have written about this market every month this year, and looking back, I described it one notch too kindly each time. In my May market update I said supply was the story and demand was not softening. In June I called it friction. In July I said the market was not weakening, it was waiting. In August I called it stagnation. September is not friction or a pause. It is a demand slowdown, and October starts on worse financing than September did.
Track the financing side weekly on my Nashville mortgage rate tracker, and find every prior month in my Nashville housing market analysis archive.
Middle Tennessee Housing Market Key Takeaways: September 2026
- Active inventory rose 8% to an average of 14,249 homes, flat with July and August
- New contracts fell 3% to 2,927, the second year-over-year decline in three months, after growing 9% to 18% every month from March through June
- Months of supply rose to 5.41 from 4.87 a year ago and 4.80 in June
- List-to-contract time rose 10% to 63 days and has lengthened every month since July
- Average sale price rose 5% to $631,993; the median rose 2% to $444,169, below the 3.4% inflation rate
- New listings fell 19% to 5,441. Inventory stopped rising because fewer sellers listed, not because buyers came back
- Under-contract inventory fell 4% to 5,134, which means fewer closings in October and November
- Davidson County carried 6.46 months of supply; Williamson County went from 4.01 months in June to 5.33
Middle Tennessee Real Estate Market Data: September 2026
All residential sales across the ten-county region: Davidson, Williamson, Rutherford, Wilson, Sumner, Maury, Montgomery, Robertson, Dickson, and Cheatham, from Realtracs MLS.
| Metric | Sep 2025 | Sep 2026 | YoY |
|---|---|---|---|
| New Listings | 6,687 | 5,441 | −19% |
| New Under Contract | 3,004 | 2,927 | −3% |
| Active Inventory (Avg) | 13,141 | 14,249 | +8% |
| Under Contract Inventory (Avg) | 5,361 | 5,134 | −4% |
| Total Inventory | 18,502 | 19,382 | +5% |
| Closings | 3,205 | 3,073 | −4% |
| Sale Price (Avg) | $601,444 | $631,993 | +5% |
| Sale Price (Med) | $437,000 | $444,169 | +2% |
| Avg DOM (Closed) | 33 | 38 | +14% |
| Avg List Price (Active) | $770,000 | $798,364 | +4% |
| List to Contract (Avg) | 57 | 63 | +10% |
| Contract to Closed (Avg) | 46 | 45 | −3% |
| List to Closed (Avg) | 101 | 102 | +1% |
| Months of Supply | 4.87 | 5.41 | +11% |
One line in that table matters more than the rest. Buyers have 8% more homes to choose from than a year ago, and they wrote 3% fewer contracts. More choice and fewer purchases is what weak demand looks like.
Why These Numbers Will Change, and By How Much
Treat the September volume numbers as a range, not a point. Over the last three months, my first-of-month pull undercounted closings by 1.6% to 9.4% and new listings by 2.1% to 17.0%, and overcounted new contracts by as much as 7.1%, because some contracts fall through after they are reported. Active inventory never moved by more than three homes. That is why I anchor this Nashville housing market report on inventory, and read closings as a floor and contracts as a ceiling.
| Metric | August as first reported | August at Oct 4 | Change |
|---|---|---|---|
| New listings | 5,537 | 5,656 | +2.1% |
| New under contract | 3,402 | 3,402 | 0.0% |
| Closings | 3,003 | 3,050 | +1.6% |
| Active inventory (avg) | 14,294 | 14,294 | 0.0% |
| Months of supply | 5.59 | 5.51 | −0.08 pts |
Averaging those three months of revisions, here is my call: September closings settle at 3,250, a 1% gain instead of a 4% decline. New listings settle at 5,975, down 11%. New contracts slip to 2,810, down 6%. Months of supply settles at 5.15. I publish the settled numbers on October 9.
Closings revise up, but they are a lagging number: contracts written in July and August. Contracts revise down, because some fall through. The settled data makes the demand picture worse, not better.
How the Nashville Housing Market Got Here: 4 Months From Friction to Slowdown
Year-over-year comparisons hide the direction. Here is every month since May as I first reported it, the same day-two vintage each time, next to the mortgage rate buyers were facing.
| Month | 30-yr rate | Contracts YoY | Active listings | Supply (months) | Days to contract | Median price | Median YoY |
|---|---|---|---|---|---|---|---|
| May | 6.44% | +11% | 13,114 | 4.56 | 54 | $459,990 | +2% |
| June | 6.49% | +12% | 13,748 | 4.80 | n/a | $474,990 | +3% |
| July | 6.54% | −1% | 14,174 | 4.92 | 58 | $457,500 | +2% |
| August | 6.67% | +1% | 14,294 | 5.59 | 59 | $450,000 | 0% |
| September | 6.86% | −3% | 14,249 | 5.41 | 63 | $444,169 | +2% |
Demand Broke in July and Has Not Recovered
From March through June, new contracts grew 9% to 18% a year while mortgage rates sat in the low-to-mid 6s. In July the 30-year averaged 6.54% and contract growth went to −1%. It has not come back: +1% in August and −3% in September, and the September figure revises down to about −6%. About 40 basis points of rate increase ended 6 months of demand growth.
There is a second turn that gets less attention. In June the 30-year was 6.49% against 6.77% a year earlier. Buyers were getting a slightly better rate than last year. On October 1 it was 7.28% against 6.34% a year earlier. Financing went from a small tailwind to a headwind of nearly a full percentage point in just 3 months. Every year-over-year demand comparison from here forward is measured against a buyer who had cheaper money.
Inventory Stopped Rising, for the Wrong Reason
Active inventory went from 13,114 in May to 14,174 in July, then stopped: 14,294 in August, 14,249 in September. A flat inventory line sounds like stabilization. It is not. New listings ran 19% below last year in September. Inventory leveled off because fewer sellers listed, not because more buyers bought. Months of supply rose through the plateau anyway, from 4.92 in July to 5.41 in September, because the homes on the market are selling more slowly.
Under-contract inventory, the homes between contract and closing, tells you what comes next. It was 5,714 in July as first reported, 5,378 in August, and 5,134 in September. With contract-to-close running 45 days, that pipeline is October and November’s closings, and it is shrinking. Expect weak Q4 2026 closing counts.
Prices Are Not Falling. They Are Losing to Inflation.
Be precise about prices, because this is where it is easy to overstate the bad news. The regional median fell from $474,990 in June to $444,169 in September. Much of that is seasonal. Last year the median went from $447,850 in July to $437,000 in September, down 2.4%. This year it went from $457,500 to $444,169, down 2.9%. Sequentially, the median is doing what it does every fall, slightly worse.
The problem is the year-over-year line. Median growth went from +3% in June to +2%, 0%, and +2%. With consumer prices up 3.4% over the past year, the typical Middle Tennessee home lost value in real terms. The average fell harder than seasonal: from $646,875 in July to $631,993 in September, down 2.3%, against a 1.4% drop over the same months last year. The upper price ranges, which carried price growth all year, are softening fastest.
What I Got Right, and What I Underestimated
The direction I called this summer held. The speed did not. I underestimated how fast this market would slow once rates moved.
- May: I said supply was the constraint and that demand was holding. Demand held through June, then rolled over. I also expected prices to keep rising through the back half of the year. The September median of $444,169 sits $15,821 below May’s $459,990. Much of that is seasonal, but I underestimated how quickly price gains would stall.
- June: I said rates rising toward 7% would expand buyer leverage. Rates got there and leverage expanded. I expected inventory to keep building; instead it flattened because fewer sellers listed.
- July: I said the market was repricing around a 6.66% mortgage rather than weakening. Demand had already started to turn, and I underestimated how far it would fall.
- July: I projected months of supply would reach 5.4 to 6.2 by year-end. It hit 5.41 to 5.51 in August and September, 4 months early.
- August: I called a Fed hike the base case for September, and the Fed hiked on September 16. I overestimated how much August’s volume counts would revise.
The common thread: I underestimated how fast this market responds to rates and how far demand falls when they rise. The forecast below corrects for that.
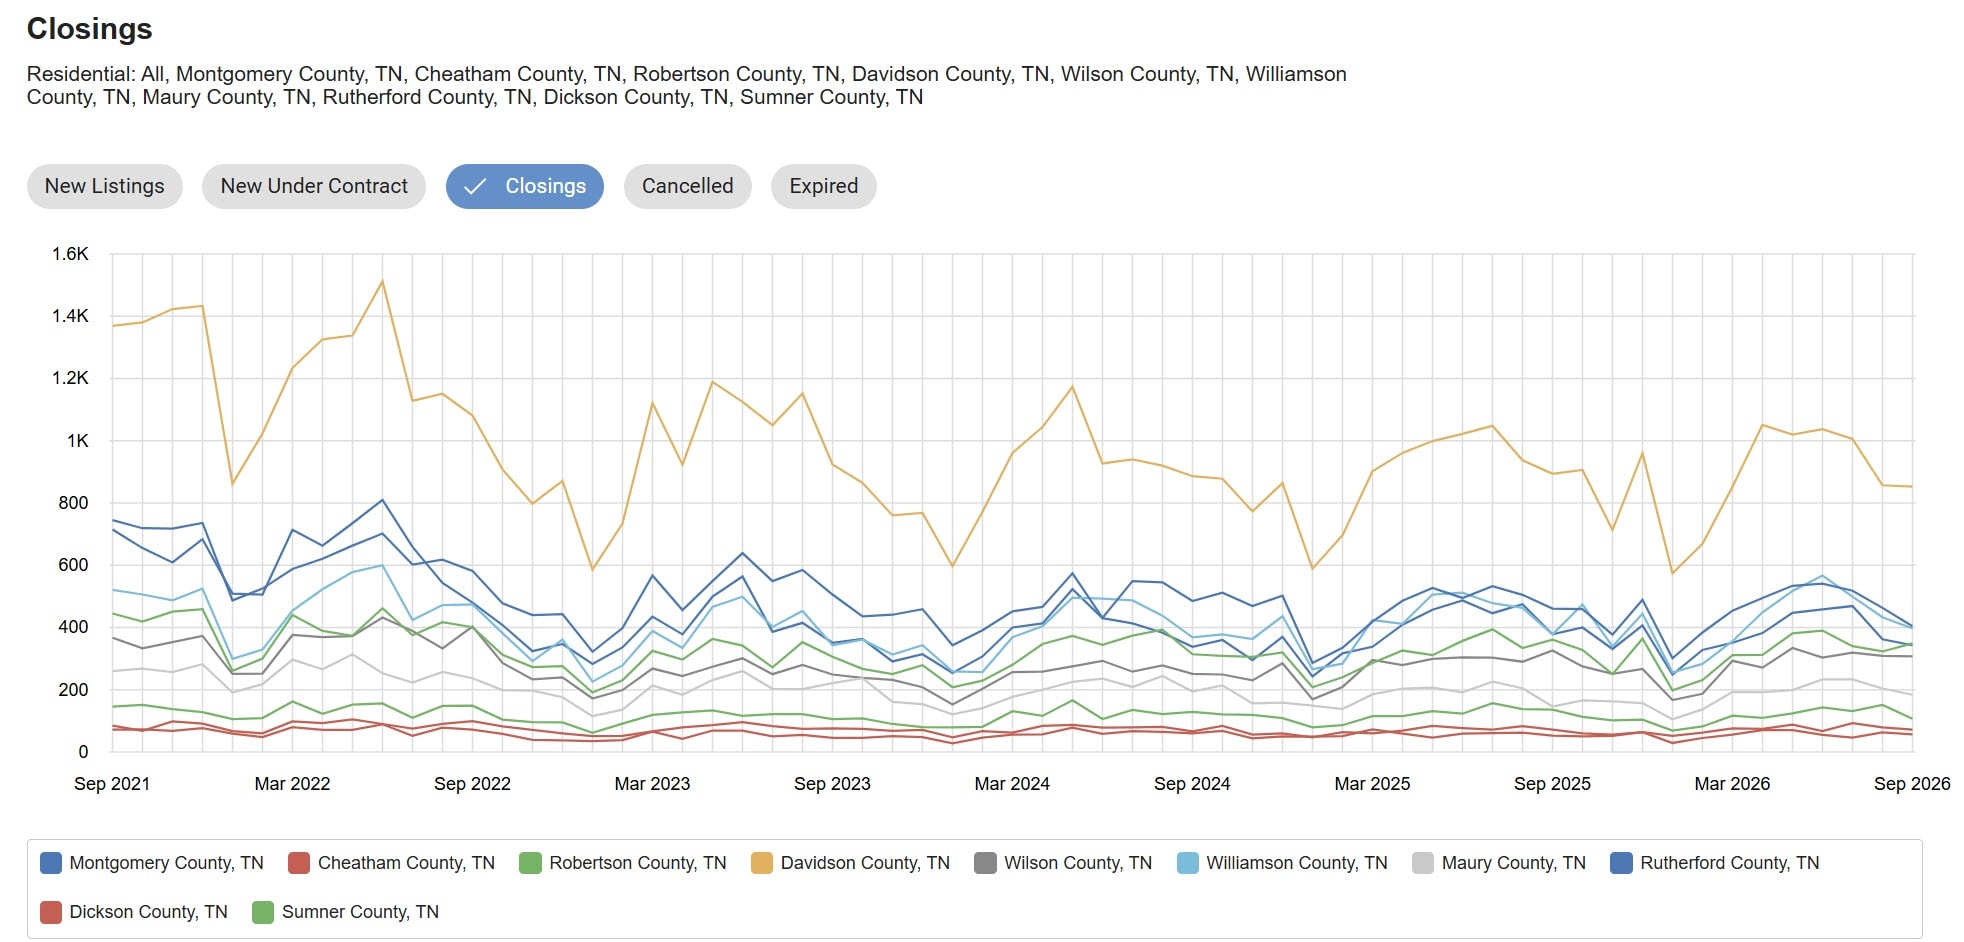
Why the Nashville Housing Market Is Behaving This Way
The Fed Raised Rates, and Mortgages Followed
On September 16 the Federal Reserve raised the federal funds target range by a quarter point to 3.75% to 4.00%. The vote was 12 to 0. In July the Committee held with three members dissenting for a hike. In September nobody dissented. The statement said inflation “remains elevated.”
Freddie Mac put the 30-year fixed at 7.28% on October 1, up from 7.03% a week earlier and 6.71% on September 3. The 15-year averaged 6.60%. That is 57 basis points in four weeks, and much of September’s contract activity was written before rates crossed 7%. September understates the financing pressure October buyers face.
Why Rates Did Not Fall With the Jobs Report
September’s jobs report was weak. The Bureau of Labor Statistics reported 29,000 new payroll jobs with unemployment at 4.2%, and July and August were revised down a combined 60,000. Long-term yields barely moved: the 10-year Treasury closed September at 5.29%, per the Fed’s H.15 release, a level it last reached before the 2008 financial crisis.
Bond investors are watching inflation, not jobs. August CPI rose 0.4% for the month and 3.4% over the year, core 2.4%, and the Fed’s preferred PCE gauge ran 3.4%. The pressure is also global: Japan’s 10-year government bond yield hit 3.055% on September 24, its highest since 1996, thinning one of the largest foreign bids for US Treasuries. Your mortgage takes its cue from the 10-year, and the 10-year has a global order book.
The economy is slowing enough to weaken demand in the Nashville housing market, but not enough to bring mortgage rates down. That is the worst combination for housing, and it is the one we have.
Closed Home Price Trends Over the Last 12 Months in Middle Tennessee
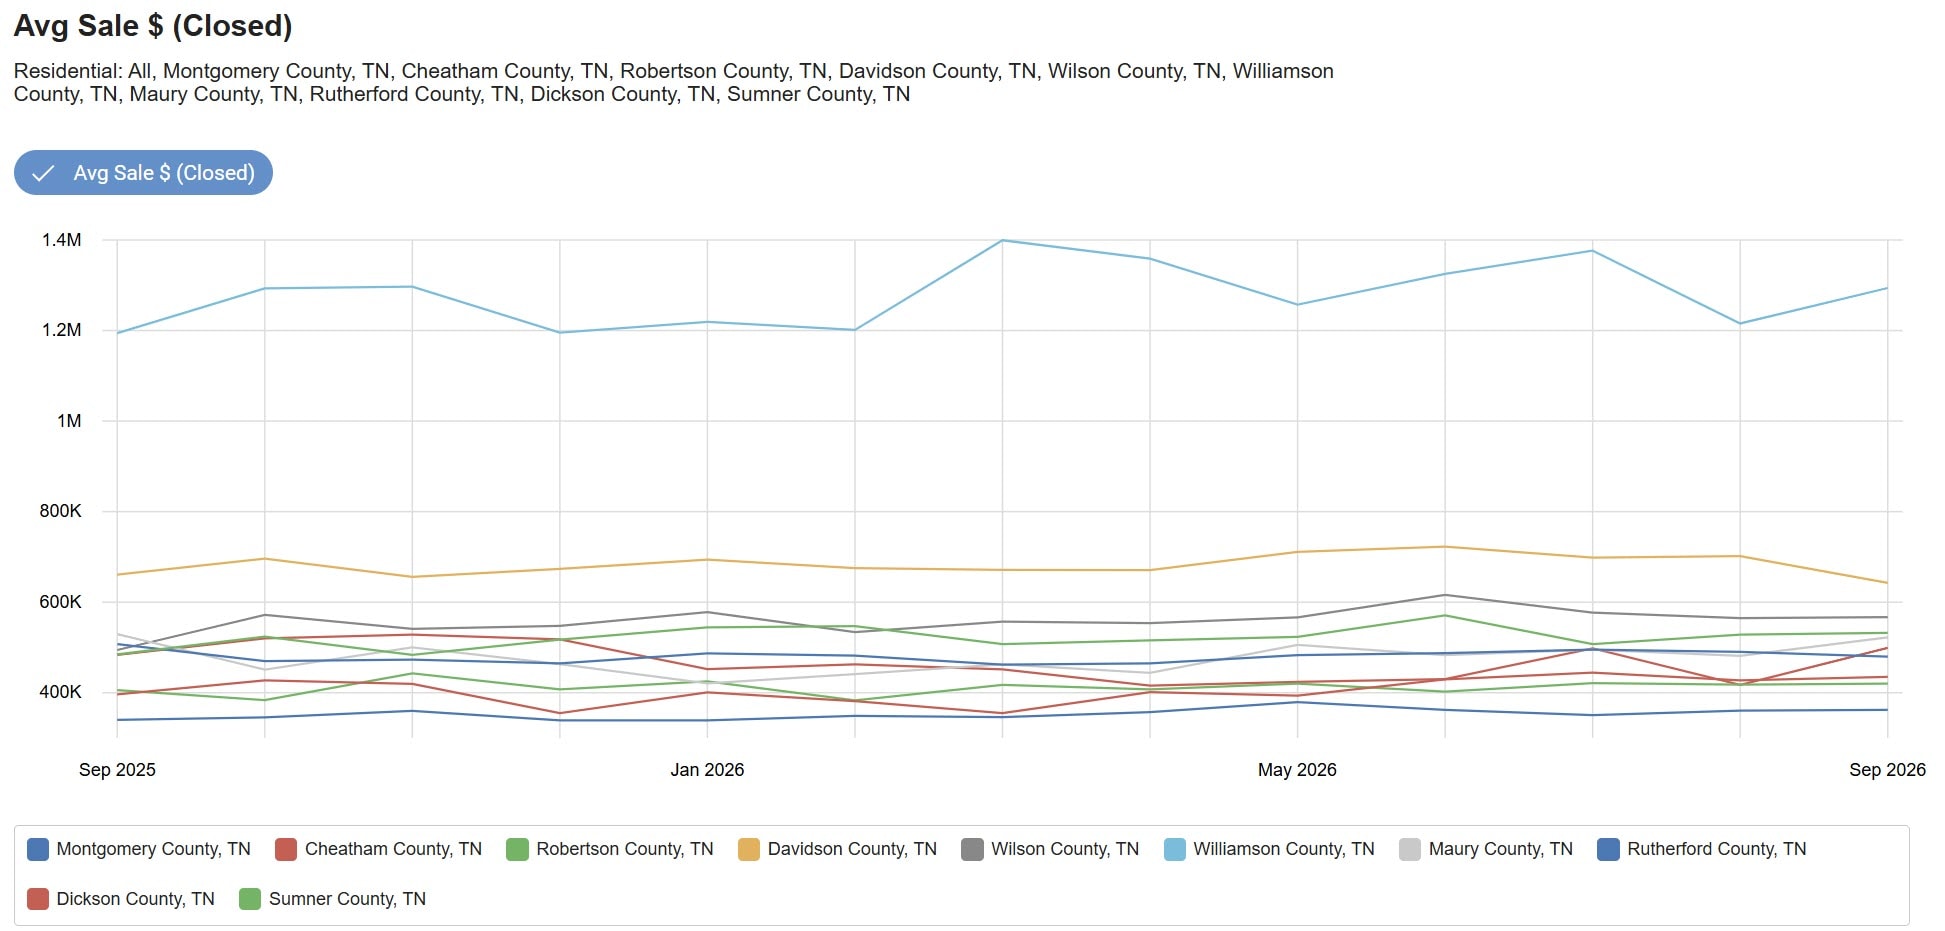
The average Middle Tennessee home sold for $631,993 in September, 5% above a year ago, and the median rose 2% to $444,169. The gap between them is $187,824, up from $164,444 a year ago, so the remaining price growth is concentrated in the upper tier. Williamson County closed at a $1,294,033 average on a $950,000 median. The middle of the Nashville housing market, the segment most exposed to a 7% mortgage, is growing slower than inflation.
The chart’s Williamson line peaked in March and has not returned to that level, and Davidson’s average fell from $730,085 in June to $642,502 in September. One month of a county average is noise, so read these lines for direction, not for any single month’s level.
County-Level Real Estate Trends in Middle Tennessee
| County | Closings | Avg Sale Price | Median Sale Price | Avg DOM | Months of Supply |
|---|---|---|---|---|---|
| Davidson | 853 | $642,502 | $450,000 | 39 | 6.46 |
| Montgomery | 343 | $361,859 | $335,000 | 39 | 5.83 |
| Dickson | 72 | $435,253 | $345,500 | 47 | 5.81 |
| Maury | 184 | $522,514 | $422,998 | 38 | 5.45 |
| Williamson | 397 | $1,294,033 | $950,000 | 41 | 5.33 |
| Cheatham | 57 | $498,992 | $415,000 | 52 | 5.22 |
| Rutherford | 404 | $479,656 | $422,940 | 35 | 4.91 |
| Robertson | 107 | $419,975 | $375,000 | 25 | 4.58 |
| Sumner | 349 | $532,416 | $446,000 | 34 | 4.32 |
| Wilson | 307 | $567,068 | $499,900 | 34 | 4.22 |
| Ten-county region | 3,073 | $631,993 | $444,169 | 38 | 5.41 |
Four Months of Supply in the Five Largest Counties
| County | Jun | Jul | Aug | Sep |
|---|---|---|---|---|
| Davidson | 5.69 | 5.97 | 6.89 | 6.46 |
| Williamson | 4.01 | 4.59 | 5.18 | 5.33 |
| Maury | 5.19 | 4.91 | 5.84 | 5.45 |
| Rutherford | 3.96 | 4.02 | 4.61 | 4.91 |
| Wilson | 4.41 | 4.51 | 4.70 | 4.22 |
Early in the month, the county rankings are more reliable than the exact figures, because every county’s numbers revise in the same direction. Davidson County has carried the most supply of any large county in the Nashville housing market all summer. At 6.46 months it is past the 6-month line where a market favors buyers, and the average listing needs 69 days to reach contract.
The bigger change is Williamson. In June it was the second-tightest major county at 4.01 months, behind only Rutherford, and in May I wrote that its inventory could not keep up with relocation demand. It has loosened every month since, to 5.33, and its median fell from $999,000 in June to $950,000. Franklin and Brentwood sellers are now in a balanced market, not a scarce one. Rutherford has followed the same path, from 3.96 to 4.91.
Wilson is the exception, back to 4.22 and the tightest county in the region, then Sumner at 4.32 and Robertson at 4.58. Montgomery at 5.83 and Dickson at 5.81 sit just below Davidson, and Cheatham has the slowest pipeline at 97 days list-to-contract.
What Months of Supply Means in the Nashville Housing Market
Months of supply measures how long it would take to sell every active listing at the current pace. Under 4 favors sellers. 4 to 6 is balanced. Above 6 favors buyers. The Nashville housing market reads 5.41 and settles at 5.15. Still balanced, but up from 4.56 in May, and every month since May has read higher than the same month last year.
Nationally, the existing-home market carried 4.9 months of supply in August, the highest in over a decade, per the National Association of Realtors. The Nashville housing market sits half a month above that. In June the gap was 0.2 months, 4.80 against 4.6 nationally. The region is changing faster than the country.
Nashville Housing Market Forecast: Where Middle Tennessee Is Headed
As of October 2, futures price a hold in October and a December hike as close to certain. That makes the first scenario below the base case for the Nashville housing market and the relief scenario the least probable of the three.
If rates hold at 7% or higher (the base case), new contracts run 5% to 10% below last year through December. List-to-contract time passes 70 days by year-end. Months of supply crosses 6 regionally in December or January, when winter seasonality pushes it higher every year. Fourth-quarter closings fall year over year as the shrinking pipeline closes. The median holds within a few percent of last year; the average keeps softening.
If rates push deeper into the 7s, concessions and price reductions become the norm for anything not priced to the last 90 days of sales, and the median goes negative year over year by the spring 2027 market. New listings 19% below last year slow the price decline. They do not stop it.
If the 10-year retreats and mortgages return to the low 6s, demand comes back fast. Spring proved it: contracts grew 18% in April on a low-6% mortgage. Nothing in the futures market or the Fed’s September statement points that way this year.
Housing markets adjust through volume first, negotiating leverage second, and price last. Middle Tennessee finished the first stage this summer and is well into the second.
What to Watch in the Nashville Housing Market in October
The October 27 and 28 Fed Meeting
The FOMC meets October 27 and 28. It carries no new dot plot; that comes December 8 and 9. CME FedWatch put an October hike near 20% after the October 2 jobs report, down from about 70% a week earlier, while a December hike is priced close to certain. September CPI arrives mid-month and decides which way those odds move.
The Fall Window Is Closing
The buyer pool in the Nashville housing market thins through late October and does not return until February. At 63 days list-to-contract, a home listed in mid-October negotiates over the holidays. A seller who needs to sell before spring is listing now, priced to the market, or not at all.
If You Are Under Contract Right Now
Rates rose 57 basis points in four weeks. Have the lock-or-float conversation with your lender this week, not the week before closing. My weekly Nashville mortgage rates update tracks local quotes alongside the national survey.
What This Means for Buyers, Sellers, and Investors
Buyers: More Leverage, a Higher Payment
Your negotiating position in the Nashville housing market is the strongest it has been this year. You have 14,249 homes to choose from and sellers waiting 63 days for a contract. Use it: ask for price, closing costs, and a rate buydown on the same offer, especially on listings past 45 to 60 days in Davidson, Montgomery, Dickson, Maury, and Williamson Counties.
But be clear about what waiting has cost. At the May median of $459,990 and May’s 6.44% average rate, principal and interest on a 30-year loan with 20% down was $2,311 a month. At September’s median of $444,169 and today’s 7.28%, it is $2,431. A year ago, at a $437,000 median and 6.34%, it was $2,173. The house got cheaper and the payment got more expensive. If you are waiting for both to improve at once, the futures market says that is not happening this year.
Sellers: Price for the Market You Have
The four-month trend in the Nashville housing market is against you, and it is better to hear it now than in February. Demand is shrinking, the payment your buyer faces is up about $258 a month from a year ago, and list-to-contract time has lengthened every month since July. Your median price is still up 2% on paper, which is less than inflation. Overpricing a listing in October now risks more than a few weeks; it means sitting through the holidays and relisting into a spring market with more competition. Price to the last 90 days of closed sales, not to active listings; the actives are the homes that have not sold. If you need to give something, consider a rate buydown before a price cut. On a $355,000 loan at 7.28%, a quarter-point lower rate saves the buyer about $60 a month; a 1% price cut saves about $24. Ask the buyer’s lender what the buydown costs before you negotiate.
Investors: Better Prices, Worse Money
Purchase prices are more negotiable than at any point this year, but the cost of capital rose faster than prices fell. On a $444,169 home, a 3% price discount saves about $73 a month at 7.28%. The rise in rates since last year costs about $223 on the same home. Underwrite at today’s rate, not the one you hope to refinance into, and expect the best entry prices in the Nashville housing market to come over the winter, not this month.
After 25 years in Middle Tennessee real estate, across luxury homes, 350-plus downtown high-rise condo closings, 550-plus short-term-rental transactions, and more than $1 billion in career sales, I have learned that markets turn over a season, not a month, and the monthly report always sounds calmer than the trend. This summer was the turn in the Nashville housing market.
Middle Tennessee does not have too many homes. It has too few buyers who can make today’s payment, and that number is shrinking. Plan your next move around that, not around a rate drop the market is not pricing.
Nashville and Middle Tennessee Real Estate Market FAQ
What happened in the Nashville housing market in September 2026?
Demand weakened while inventory held steady. New contracts fell 3% year over year to 2,927, active inventory rose 8% to 14,249, and months of supply reached 5.41. New contracts grew 11% to 12% in May and June and have been flat or negative every month since July, as the 30-year mortgage rate rose from 6.49% in late June to 7.28% on October 1.
Are Nashville home prices falling?
Not year over year, but they are losing to inflation. The regional median rose 2% to $444,169 while consumer prices rose 3.4%, so the typical home lost value in real terms. The median’s 2.9% July-to-September drop is close to last year’s 2.4% seasonal decline. The average fell 2.3% over the same months, faster than last year’s 1.4%, as the upper tier softened.
Is Nashville a buyer’s market?
Davidson County is, at 6.46 months of supply, and the rest of the region is moving that way. Regional months of supply is 5.41, up from 4.56 in May, and listings need 63 days to reach contract. Buyers have more leverage than at any point this year, but higher mortgage rates mean the monthly payment is higher than a year ago.
Why do these numbers change after they are published?
I pull the data in the first days of the month, before agents finish entering closings and listings. August closings were first reported at 3,003 and stood at 3,050 a month later; new listings went from 5,537 to 5,656. Active inventory did not change, because it is a snapshot rather than a count of reported events, which is why I treat it as the most reliable figure in an early-month report.
Which Middle Tennessee counties are tightest, and where do buyers have the most leverage?
Wilson County is tightest at 4.22 months of supply, then Sumner at 4.32 and Robertson at 4.58. Buyers have the most leverage in Davidson County at 6.46 months, followed by Montgomery at 5.83 and Dickson at 5.81. Williamson has loosened the most since June, from 4.01 months to 5.33.
What would change the Nashville housing market for the rest of 2026?
Only mortgage rates, and they are moving the wrong way. Freddie Mac’s 30-year fixed reached 7.28% on October 1 after the Fed raised its target range to 3.75% to 4.00% on September 16, and futures price another hike by December. At 7% or higher, expect contracts to keep falling and months of supply to cross 6 this winter. A return to the low 6s would bring buyers back quickly, but nothing currently points that way.
- Middle Tennessee Real Estate Market Update August 2026
- Middle Tennessee Real Estate Market Update July 2026
- Middle Tennessee Real Estate Market Update June 2026
- Middle Tennessee Real Estate Market Update May 2026
- Nashville Housing Market 2026 Outlook
- Nashville Mortgage Rates Today
Data and disclosure: September 2026 Realtracs MLS figures are preliminary (report date October 4, 2026), so volume comparisons against settled September 2025 data overstate declines. Trend tables show each month as first reported. Revision projections are my estimates from June through August 2026 revisions. Monthly mortgage rates average Freddie Mac PMMS weekly readings; payments are principal and interest on a 30-year fixed loan with 20% down. Sources: Freddie Mac PMMS (10/1), FOMC statement (9/16), BLS jobs (10/2) and CPI (9/11), BEA PCE (9/30), NAR existing-home sales (9/10), Federal Reserve H.15 10-year close (9/30), and CME FedWatch, all 2026. Forecasts are my own and may differ materially from actual results. This is not investment advice. Grant Hammond is a Tennessee-licensed broker (#281540) at Compass RE.
Full library of Middle Tennessee housing data, weekly mortgage-rate analysis, and condo, luxury, and Airbnb research at the Nashville real estate research hub.