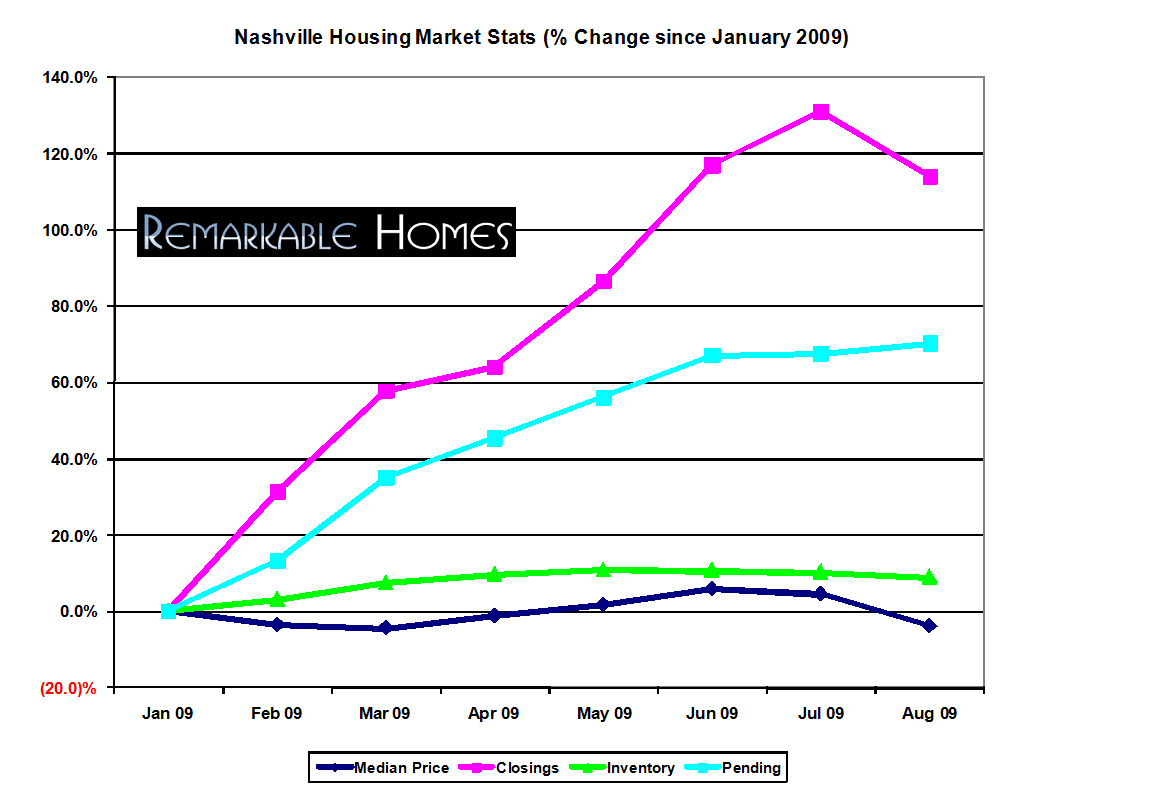
August 2009 Nashville real estate market analysis shows a market beginning to stabilize, even as pricing remained under pressure. Inventory declined, pending sales surged, and year over year gaps narrowed across key metrics.
While national headlines remained negative, local data suggested improving conditions within the Nashville real estate market. The question was whether this momentum could continue into the typical fall slowdown.
Inventory Levels Continue to Improve
Total inventory declined 1.22% from July, marking continued progress. However, inventory remained 8.86% higher than January levels.
There were 17,318 active homes and condos in August. That compares to 18,211 in August 2008, a year over year decrease of 5.16%. This was one of the more encouraging signals in the report.
Pending Sales Surge Higher
Pending sales showed one of the strongest trends in the August 2009 Nashville real estate market analysis. Since January, pending transactions increased 70.12%.
For the first time in 2009, pending sales exceeded year ago levels. August was 1.45% higher than August 2008. It also represented a 12% month over month increase and a new high for the year.
This shift suggested improving buyer confidence and stronger contract activity.
Closed Sales Show Seasonal Slowdown
Closed sales declined month over month for the first time in 2009. Closings fell 13% from July levels.
Even so, closings were only down 9.97% compared to August 2008. The year over year gap narrowed by another 2.1% during the month.
This pattern is consistent with seasonal trends. Late summer often marks the beginning of slower closing activity.
Median Prices Decline
Median prices dropped 8.25% month over month to $158,376. This was the largest decline since March.
Year over year, prices were down 9.75% from $175,504 in August 2008.
This decline was influenced by increased activity from first-time buyers and a growing share of short sales and foreclosures. These trends are consistent with broader housing market trends during downturn cycles.
Months of Inventory Stabilizes
Based on closed sales, the market held 8.77 months of inventory. Based on pending sales, the figure improved to 7.95 months.
Just three months earlier, inventory stood at 10.2 months. That represents an 18% reduction in supply pressure.
This improvement in absorption was one of the strongest indicators of market stabilization.
What the August Data Suggests
While pricing remained weak, underlying fundamentals improved. Inventory declined, pending sales increased, and absorption strengthened.
This suggests that the second half of 2009 was shaping up to outperform the second half of 2008.
However, price pressure was likely to continue. Fewer luxury transactions and increased distressed sales were expected to weigh on median values.
Forward Outlook
Looking ahead, lenders were expected to increase foreclosure activity into the fall. This would likely add additional supply to the market.
At the same time, pending and closed sales were expected to improve on a year over year basis.
Understanding how inventory, pricing, and absorption interact is critical for interpreting these shifts. For more financing-related insights, explore Nashville mortgage rates and financing.



September 9, 2009, 9:22 pm
September 15, 2009, 5:35 pm
October 4, 2009, 12:25 am
October 29, 2009, 8:40 am
November 11, 2009, 6:58 pm
January 13, 2010, 10:16 pm