That’s the entire month in one line. The rest of what I’ll cover unpacks what those numbers mean for sellers, buyers, and investors making decisions across Davidson, Williamson, Rutherford, Wilson, Sumner, Maury, Robertson, Cheatham, Dickson, and Montgomery Counties. These are the ten counties I work in across Middle Tennessee, and after 25 years here, this current setup is the most prolonged supply-side contraction I’ve watched.
Bottom Line Up Front: three things to know about the May 2026 Middle Tennessee market
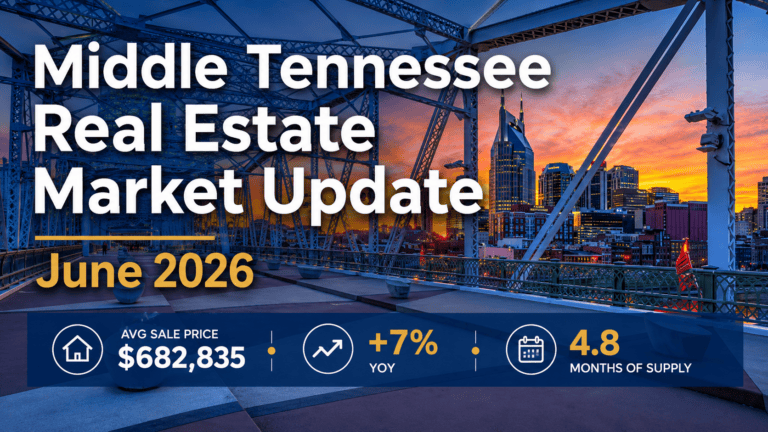
- Supply is the story. 6,142 new listings versus 7,589 a year ago. The mortgage rate lock-in effect is real, persistent, and pricing-supportive for sellers who do list.
- Demand isn’t softening, transaction volume is. Closings dropped 4% while new under-contract activity grew 11%. The pipeline is full. June and July closings should reflect that.
- The $190K gap between average ($650,362) and median ($459,990) sale prices is luxury skew, not a bubble. The middle of the market grew at 2% year-over-year. That’s normal appreciation in a normal year.
What’s the single most important number in the May 2026 Middle Tennessee market?
When I look at this month’s numbers, the 19% drop in new listings is the number that explains everything else.
Sellers who refinanced or bought between 2020 and 2022 are holding mortgage rates two to four percentage points below today’s market. The math creates a powerful disincentive to list. Trading a 3% mortgage for a 6.5% mortgage on a comparable home means a 30 to 40% monthly payment increase even if the new home costs exactly what the current home is worth. So they don’t list. Multiply that across the entire homeowner base who locked in 2020-2022 rates, and you get a 19% year-over-year supply contraction at the regional level.
That’s not a Middle Tennessee story. It’s a national story showing up in Middle Tennessee data. What I find specific to our region is that demand didn’t drop with supply. Most other metros showing similar lock-in effects are seeing buyer formation contract alongside the listing contraction. Nashville’s job growth, in-migration patterns, and household formation are still feeding net new buyer demand. That asymmetry, supply down 19% and demand up 11%, is the entire pricing story for the year.
When supply contracts and demand doesn’t, prices go up. That’s what the 6% average sale price growth is telling us. It’s not speculation. It’s mechanics.
Why did new listings drop 19% while buyer activity climbed?
I see two structural forces driving this, and neither of them is unwinding by Labor Day.
The mortgage rate lock-in effect is persistent. Roughly 60% of Middle Tennessee homeowners have a mortgage rate below 5%. About 30% have a rate below 4%. Until rates fall back toward the 5% range, or until life events force a sale (job relocation, divorce, downsizing, inheritance), the structural floor on new listings stays depressed. Every economist forecast I’m reading suggests we don’t get back to 5% mortgage rates until 2027 at the earliest. So this dynamic isn’t going anywhere.
Builder hesitancy is the second force. New construction starts across Middle Tennessee have been measured through the first half of 2026. Builders are watching absorption rates carefully and not over-building speculatively the way they did in 2021-2022. When existing-home sellers stay put and builders keep inventory disciplined, the new-listing number contracts on both sides simultaneously.
But here’s what makes our market different: buyer demand doesn’t care about either of these dynamics. First-time buyers have to transact regardless of rate. Relocating households have to transact. Investors looking for cash-flowing rental property have to transact. New household formation continues regardless of where rates sit. The lock-in effect is asymmetric. It locks sellers in, but doesn’t lock buyers out.
That asymmetry is the single most important market dynamic in the region right now, and understanding it changes how you should think about your specific transaction.
What does 4.56 months of supply actually mean for Middle Tennessee sellers?
Four to six months of supply is conventionally called balanced. May 2026 at 4.56 months is technically balanced, with a modest lean toward buyers compared to a year ago.
But “balanced” obscures what’s happening underneath. Active inventory grew 8% while new listings dropped 19%. The available inventory pool is getting more concentrated in homes that have been sitting longer. Average list-to-contract expanded from 49 to 54 days. Properties listed in March that haven’t sold yet are still sitting in the active inventory pool, and they’re the ones inflating the average days-on-market number.
Well-priced new listings still move quickly. Properties that hit the market in the first week of May with accurate pricing and proper preparation were under contract within two weeks. The 34-day average includes those fast-movers blended with the older inventory that finally cleared at month three or four.
Here’s what I tell sellers right now: 2022 muscle memory does not apply. Listing 5-10% above comparable closed sales in hopes of bidding wars is more likely to produce a three-month listing window with one or two price reductions than a competitive multiple-offer situation. The first 10 days on the market matter more than the next 100. Photography quality, staging investment, deferred maintenance resolution, and accurate day-one pricing are the variables you control.
A tactical insight I share with my clients: the gap between list-to-contract (54 days average) and contract-to-closed (41 days average) tells you that once a property enters the showing pool with accurate pricing, contracts form quickly and closings follow predictably. The drag is entirely in the marketing phase. Sellers who shorten their marketing phase capture velocity. Sellers who don’t, don’t.
What does 4.56 months of supply mean for Middle Tennessee buyers?
If you’re a buyer right now, you’re walking into the most favorable Middle Tennessee window in five years, with one major caveat.
Inventory is broader than at any point since 2019. 13,114 average active listings across the ten-county area gives you genuine selection across homes for sale across Middle Tennessee, particularly in the carryover inventory bucket. Properties that have been on the market 30 days or longer have meaningful negotiation room that didn’t exist in 2022 or 2023. Sellers of those properties have already absorbed at least one price reduction emotionally and are typically more open to credits, concessions, and rate buydowns than fresh listings are.
The major caveat is financing. Current mortgage rates push monthly payments roughly 40 to 50% higher than equivalent payments at 2021 rates. A $500,000 purchase that cost $2,100 per month at 3% costs roughly $3,160 per month at 6.5%. The math means you should evaluate three financing scenarios in parallel before settling on a strategy:
- Standard 30-year fixed at current market rate
- Temporary rate buydown (often called a 2-1 buydown) where the seller funds a lower rate for the first two years
- Adjustable-rate mortgage with a 7-year or 10-year fixed period before adjustment
The 2-1 buydown is particularly relevant in May 2026, because sellers are increasingly offering it as a concession on carryover inventory rather than reducing list price further. From the seller’s perspective, a $10,000 buydown contribution preserves the comp better than a $20,000 price reduction would. From your perspective as the buyer, the buydown directly reduces payment in the first two years, which is exactly when household budgets are most strained after a purchase.
Broker fees are not set by law and are fully negotiable. I always recommend buyers ask their agent specifically about buyer-side compensation structure under the post-NAR-settlement framework and how it affects their specific transaction.
I track the rate environment weekly on the Nashville mortgage rates today page, updated every Friday.
What does the May 2026 market mean for Middle Tennessee investors and STR buyers?
The investor angle on May 2026 is more nuanced than the primary-residence story. I’ve closed 550+ short-term rental transactions and 350+ downtown high-rise condo transactions in Nashville, so let me break this down by investor segment.
For long-term rental investors, the math is improving slowly but not aggressively. Mortgage rates remain the structural challenge. DSCR (debt service coverage ratio) deals are pricing roughly 75 to 125 basis points above owner-occupied rates, putting investor financing in the high-7s for cash-flowing single-family rental properties. Rents have grown more slowly than home prices over the trailing 12 months, which compresses cap rates. Frankly, markets where rent growth has outpaced price growth offer better entry points than Middle Tennessee currently does.
For short-term rental investors, the dynamics are entirely different, and they continue to favor entry in Nashville’s NOOSTR-eligible Airbnb inventory. Davidson County’s DTC zoning district remains the most reliable path to non-owner-occupied short-term rental eligibility, and the buildings inside that zoning band are still trading at price points that support cash-flow underwriting. Buildings like Odyssey, Hyve, and Heritage at Broadway have continued absorbing inventory through the spring 2026 window. My Best Nashville Airbnb Buildings guide covers the building-by-building landscape.
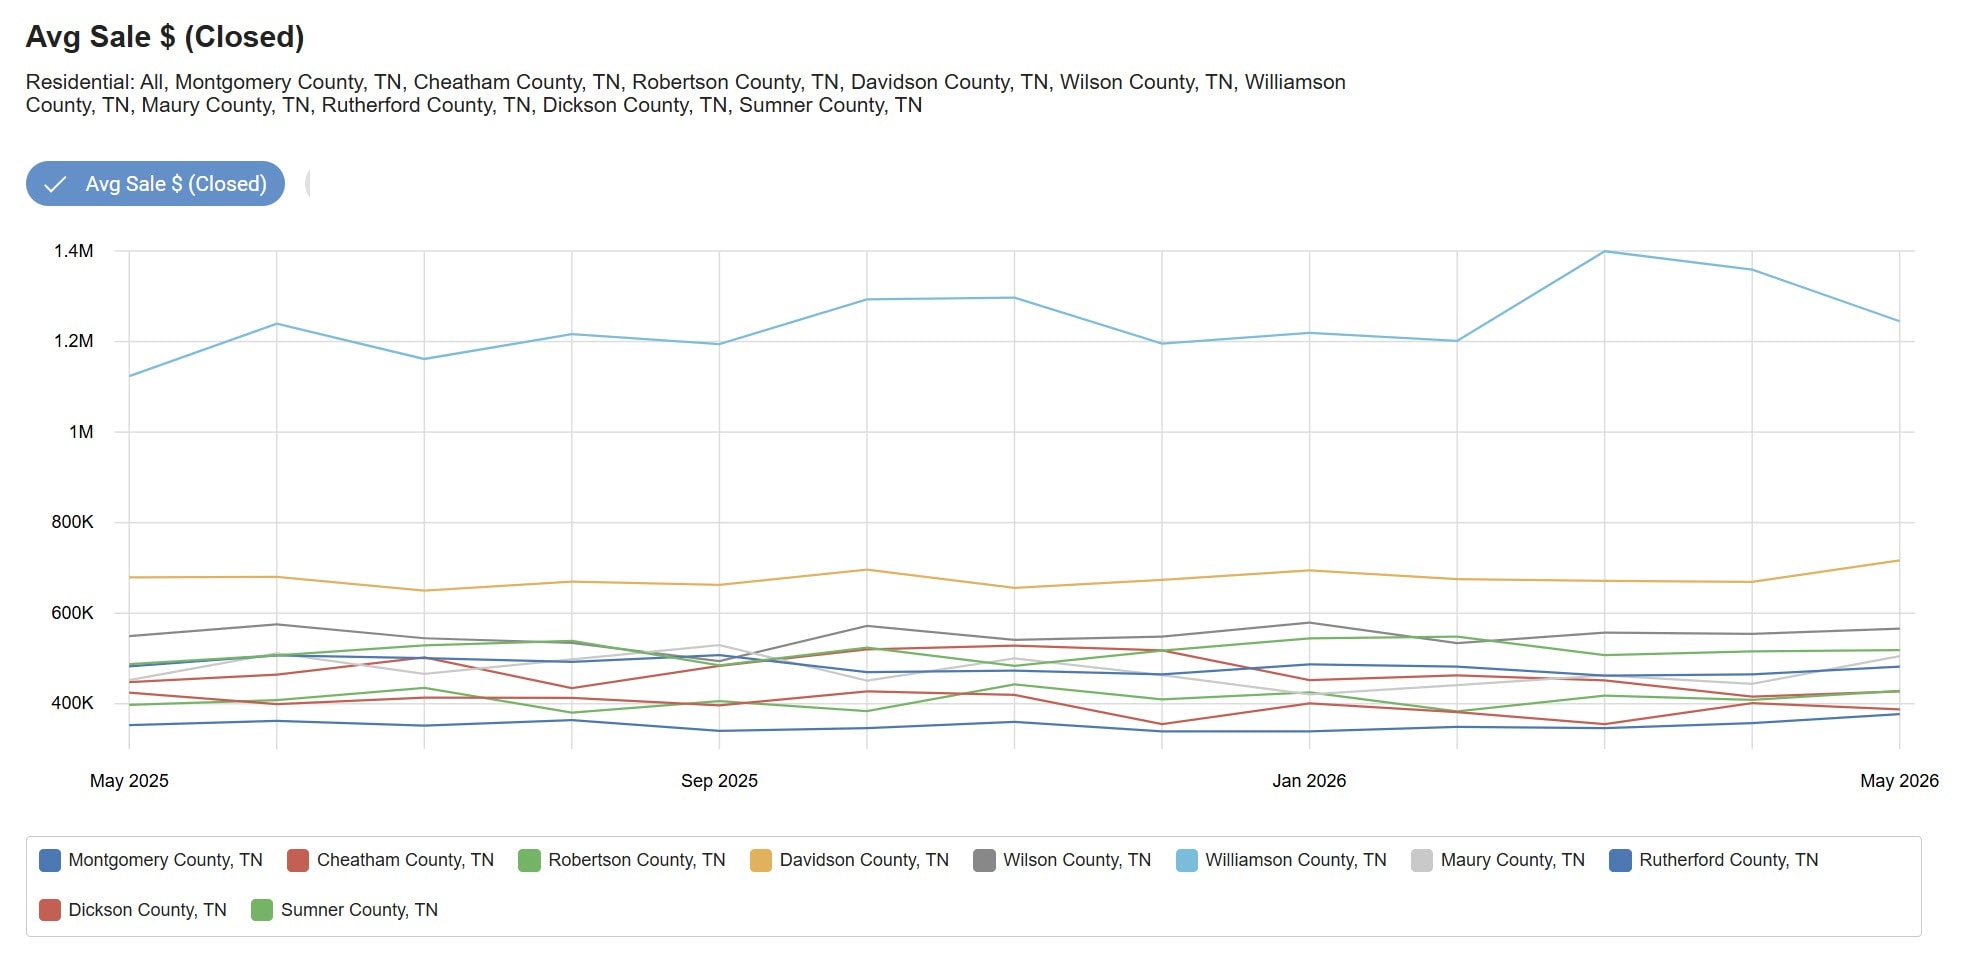
For luxury investors and primary residences above $1.5 million, Williamson County is the strongest single submarket in the region. Average closings in Williamson exceeded $1.4 million at the spring peak before settling toward $1.25 million in May. That’s a market where supply scarcity and demand from relocating high-net-worth buyers continue to outpace listing growth. Days on market in the luxury tier specifically remain notably tight compared to the broader regional average.
For move-up buyers in the $700,000 to $1.2 million range across Davidson, Williamson, and Wilson Counties, the current window is genuinely favorable. Inventory selection is broader. Carryover negotiation is real. And the May 2026 data suggests prices will continue moving upward through the back half of the year, which means buying now at current pricing locks in equity that buying in October or November won’t.
How is the Middle Tennessee luxury market different from the middle of the market?
Here’s what I see when I look at the gap between the average and the median: average sale price in May 2026 was $650,362, and median sale price was $459,990. The $190,372 gap is the luxury skew dragging the regional average upward.
The math on this gap matters. The median grew 2% year-over-year. The average grew 6%. The middle of the market, where most Middle Tennessee buyers actually transact, is appreciating at roughly historical baseline rates. The luxury tier, defined loosely as transactions above $1.5 million, is appreciating at a meaningfully faster rate.
The two markets behave differently and respond to different signals.
The middle of the market is rate-sensitive. When mortgage rates move 50 basis points, the affordability calculation changes for the typical buyer and the median price softens or accelerates accordingly. The middle market also tracks closely with broader employment, household formation, and wage growth.
The luxury market is wealth-effect driven. Equity market performance, business sale proceeds, executive relocation packages, and inheritance dynamics matter more than mortgage rate movement. Many luxury buyers pay cash or use portfolio-collateralized lending, which makes them rate-insensitive. When the median is moving 2% per year and the average is moving 6%, you’re watching two distinct customer segments operating in adjacent but separate markets.
For sellers, the implication is that pricing strategy needs to be calibrated to the segment, not to the regional headline number. A $475,000 home in Mt. Juliet competes in an entirely different market than a $1.8 million home in Forest Hills. The data for the former is the median. The data for the latter is the Williamson and Davidson County average.
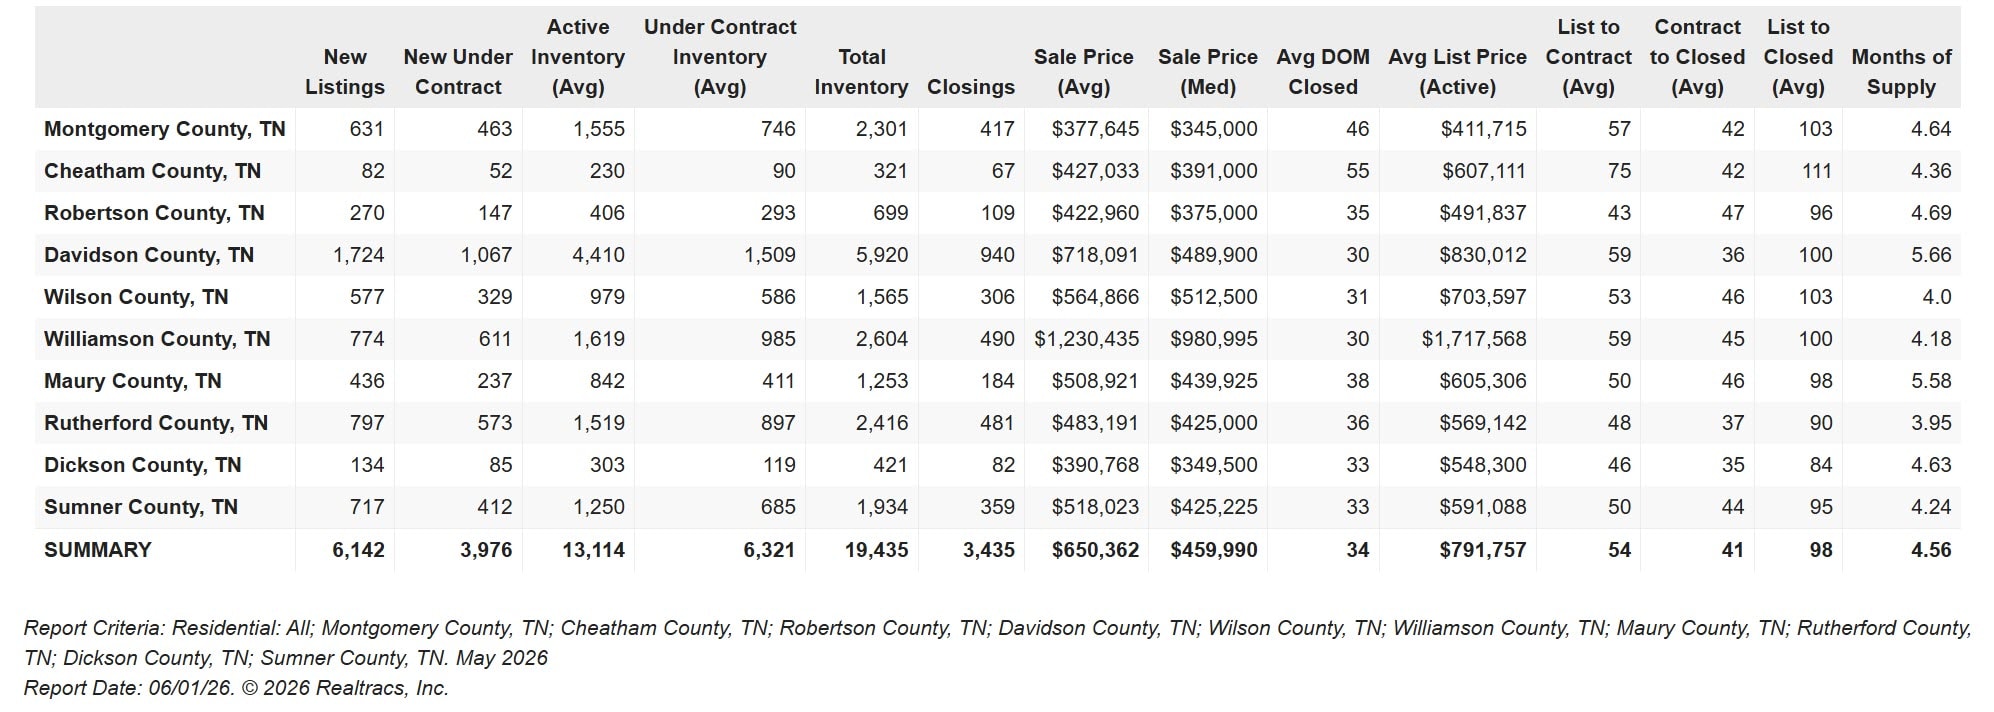
Which Middle Tennessee counties led the May 2026 market?
If I had to pick the county where the supply-versus-demand mismatch is most acute right now, it’s Williamson. The inventory there can’t keep up with relocation demand from Texas, California, and the Northeast.
Williamson County continues to lead the region on price, with average closings approaching $1.25 million in May 2026. The county saw average sale prices climb above $1.4 million earlier in the spring before settling back to current levels. No other Middle Tennessee county is approaching that price tier. Franklin homes and Brentwood homes anchor the upper end. The subdivisions driving the highest single-transaction comps include Witherspoon, Governors Club, and Rosebrooke.
Davidson County anchors the urban middle of the market, with average closings holding stable through the trailing twelve months in the $670,000 to $715,000 range. Davidson’s stability reflects its inventory diversity. The mix of Nashville condos for sale across downtown, Gulch, Midtown, and Germantown neighborhoods produces a more stable monthly average than the suburban counties that swing on small transaction counts.
Wilson County and Sumner County both cluster in the $510,000 to $580,000 range. Both benefit from the Nashville commute corridor while offering more new-construction inventory at lower per-square-foot pricing than Williamson or downtown Davidson. Mt. Juliet and Hendersonville are the volume centers.
Rutherford, Maury, Robertson, and Cheatham Counties span $385,000 to $545,000 with monthly volatility reflecting smaller transaction volumes. Murfreesboro in Rutherford remains the largest single-city market in this band. These counties are where first-time buyers and value-driven move-up buyers find the most inventory selection.
Montgomery County anchors the value end of the regional market at $330,000 to $380,000, supported by Clarksville and the Fort Campbell-adjacent communities. Dickson County overlaps in the same price band. For buyers prioritizing absolute affordability without giving up commute access to Nashville, these counties remain the most accessible entry points.
What should you watch heading into June and July 2026?
Here are five data points I’m watching closely over the next 60 days:
1. Whether closings catch up to under-contract activity. May saw closings down 4% while new under-contract grew 11%. That pipeline gap should close in June and July closings unless contract fall-through rates have spiked. If June closings remain depressed against the under-contract pipeline, that’s the first signal of buyer financing fragility worth taking seriously.
2. Whether new listings show seasonal pickup. June historically delivers the highest single-month new listing count of the year. If June 2026 listings stay 15% or more below June 2025, the lock-in effect is deepening rather than easing. If June listings recover to within 5% of 2025, supply pressure may be loosening.
3. The next Federal Reserve meeting on June 17-18. Rate expectations through Q3 will be set by this meeting and the accompanying dot plot. Mortgage rates have moved on Fed expectations more than on actual policy moves for the past two years. Watch the response in the bond market over the 48 hours after the meeting.
4. Williamson County luxury inventory. May ended with active inventory at the highest level of the spring. If June absorbs a significant portion of that inventory at or near list, the luxury tier remains structurally tight. If new listings continue accumulating without absorption, the luxury market is showing first signs of softening.
5. STR-zoned new construction permits in Davidson County. I track the monthly permit data from Metro Codes. New construction within the DTC zoning band remains the most undersupplied product in the entire regional market. Permit activity through Q3 will dictate Q4-Q1 inventory.
How does May 2026 compare to May 2024 and May 2025?
When I lay out the three-year arc on the regional average sale price, here’s what jumps out:
- May 2024: $595,128
- May 2025: $611,210
- May 2026: $650,362
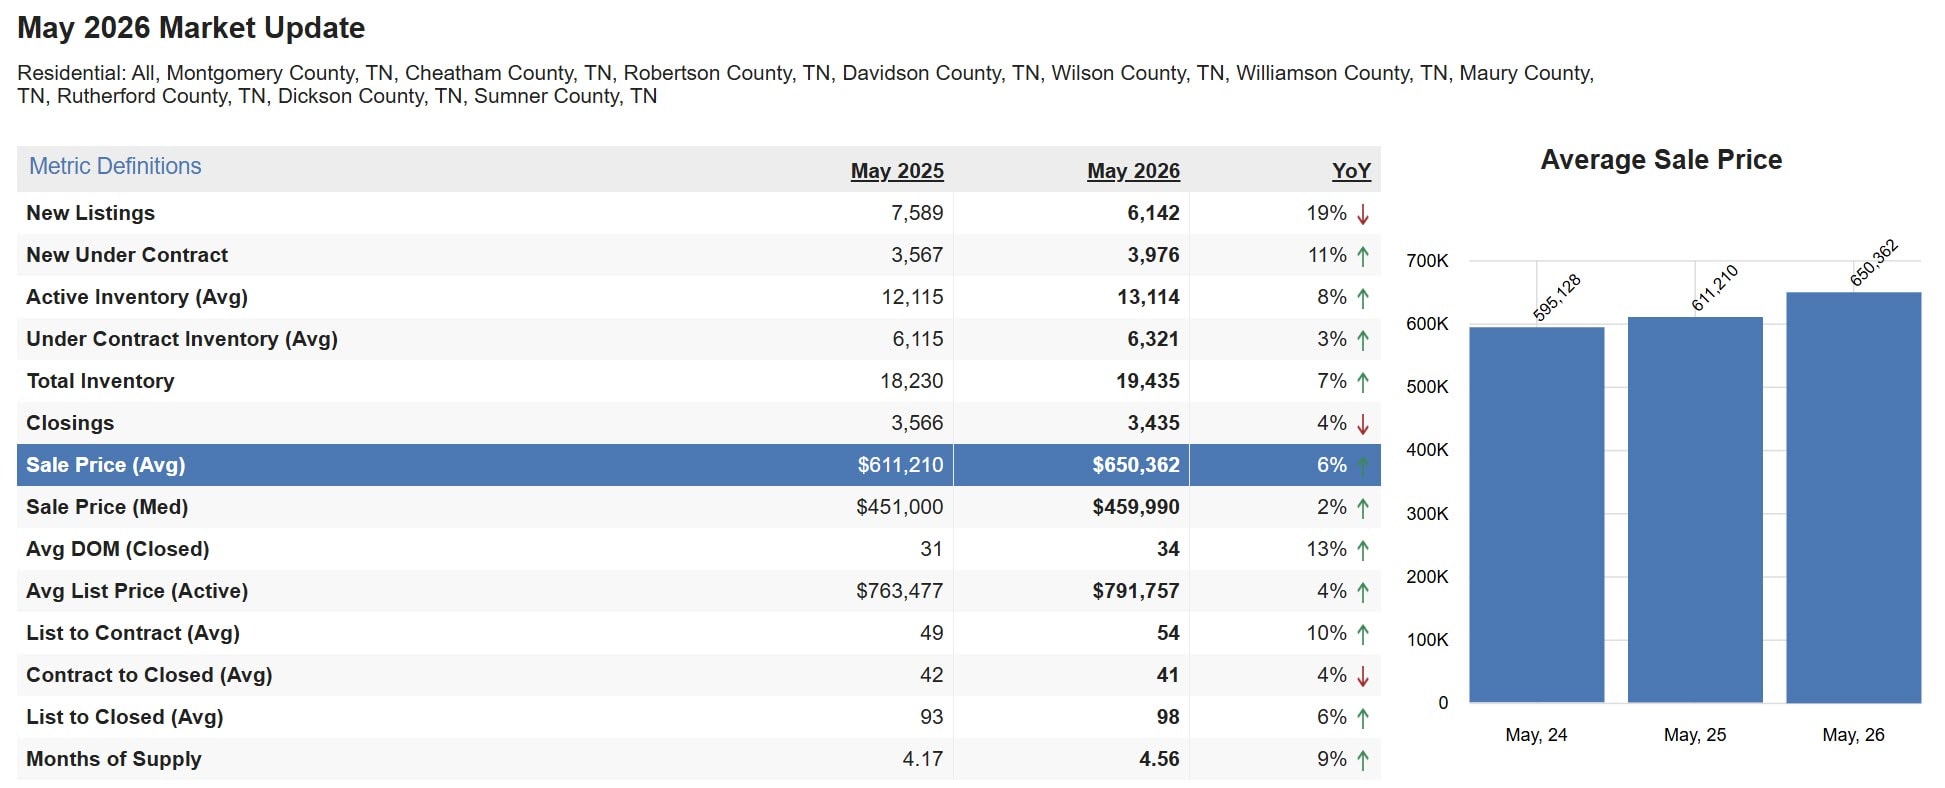
Two-year cumulative appreciation: 9.3%. Annualized: about 4.5% per year.
That’s healthy appreciation, well below the 15 to 20% annual moves of the 2020-2022 cycle, and consistent with longer-term Middle Tennessee market behavior. Nothing in the data set suggests a bubble. Nothing suggests collapse. The market is doing what a normal, growing region with steady demand does, with the supply-constraint overlay creating a slight upward bias on prices.
The May 2026 year-over-year gain of 6% is the strongest single-year movement of the three-year window. My read on the forecast risk is that it’s on the upside of the price trajectory, not the downside. The April 2026 update tracked similar momentum with prices climbing into the spring window. If demand continues to outrun new listings through the back half of the year, July and August averages may extend that trajectory.
Bottom line: what does the May 2026 Middle Tennessee market mean for your next move?
If you’re a seller: This is a strong window, but only if you price accurately on day one. The market is rewarding pricing discipline more strictly than it did a year ago. Skip the test-the-market list price strategy. List within 2-3% of recent comparable closings, invest in pre-listing preparation and photography, and expect contracts within 30 days. If you’re holding a property listed before May and you’ve had price reductions already, consider whether the buydown or concession path makes more sense than another price cut.
If you’re a buyer: This is the most favorable inventory window since 2019. Look at carryover listings (30+ days on market) for the strongest negotiation positions. Evaluate temporary rate buydowns alongside straight rate quotes. Don’t wait for a meaningful rate drop unless you have specific reason to believe one is coming. If prices keep moving up at 4 to 6% annually, the equity build offsets the rate carry within 18 to 24 months.
If you’re an investor: STR-zoned inventory in Davidson County’s DTC band is still where the cleanest cash-flow underwriting lives. Long-term rental cap rates have compressed and may not be the right entry point at current rates. Luxury speculation remains a story for cash buyers and high-net-worth households, not leveraged investors. If you’re underwriting a flip, the carryover-inventory negotiation window is real.
If you want a market analysis specific to your address, your target neighborhood, or your investment thesis, reach out to me directly. Every situation has factors the regional average can’t capture, and 25 years of Middle Tennessee transaction experience means I’ve probably seen something close to your scenario before.
Methodology
Data source: RealTracs MLS aggregated reporting for the ten-county Greater Nashville MLS area covering Montgomery, Cheatham, Robertson, Davidson, Wilson, Williamson, Maury, Rutherford, Dickson, and Sumner Counties. May 2025 and May 2026 month totals reflect transactions reported through the standard MLS reporting window as of the first business day of June 2026. County-level chart data covers the trailing twelve months from May 2025 through May 2026.
Metric definitions:
- New Listings: properties newly entered into the MLS during the reporting month
- New Under Contract: properties moving from active to under-contract status during the reporting month
- Active Inventory (Avg): average daily active listings across the reporting month
- Total Inventory: active inventory plus under-contract inventory
- Closings: properties closing during the reporting month, regardless of when they originally listed
- Months of Supply: active inventory divided by trailing-twelve-month closings, expressed as monthly equivalent
- Sale Price (Avg): arithmetic mean across all closings for the month
- Sale Price (Med): midpoint closing across all transactions for the month
- Avg DOM (Closed): days from list date to closing date for closed transactions
- List to Contract (Avg): days from list date to contract date for closed transactions
- Contract to Closed (Avg): days from contract date to closing date for closed transactions
Note on volatility: county-level monthly averages for smaller counties (Cheatham, Dickson, Robertson) can swing 10 to 15% month-to-month based on small transaction counts and individual high-dollar or low-dollar closings. The trailing-twelve-month perspective is more reliable for those counties than any single month.
Frequently Asked Questions About the May 2026 Middle Tennessee Real Estate Market
Which counties are in the Greater Nashville MLS area?
The Greater Nashville MLS area covers ten Middle Tennessee counties: Montgomery (Clarksville), Cheatham, Robertson, Davidson (Nashville), Wilson, Williamson (Franklin, Brentwood), Maury (Columbia, Spring Hill), Rutherford (Murfreesboro), Dickson, and Sumner (Hendersonville, Gallatin). Combined, these counties capture the majority of residential real estate activity in the Nashville metropolitan region.
Why is the average sale price so much higher than the median sale price in May 2026?
A small number of high-dollar transactions in Williamson County and parts of Davidson County pull the regional average upward. May 2026 average sale price was $650,362 against a $459,990 median. The $190,372 gap reflects the influence of luxury closings, particularly in Franklin, Brentwood, Belle Meade, Forest Hills, and the downtown Nashville high-rise condo market. The median is the more accurate read on where the typical Middle Tennessee transaction is trading.
Does 4.56 months of supply mean Middle Tennessee is a buyer’s market?
Four to six months of supply is generally considered balanced. May 2026 at 4.56 months is balanced but trending slightly toward buyers compared to a year ago. Properly priced new listings still move quickly. Carryover inventory in the 30-day-plus range offers more negotiation room than at any point in the trailing 24 months. The market favors disciplined sellers and prepared buyers.
What is the mortgage rate lock-in effect and why does it matter to May 2026 inventory?
Homeowners who locked in mortgage rates between 2020 and 2022 are sitting on rates two to four percentage points below current market rates. Selling and rebuying at current rates means a 30 to 40% monthly payment increase even with no price change. This keeps existing inventory off the market and is the primary driver of the 19% year-over-year decline in new listings in May 2026. The effect will not unwind materially until rates fall back toward 5% or until forced-sale life events accumulate.
When will the June 2026 Middle Tennessee market update publish?
The June 2026 Middle Tennessee market update will publish in early July 2026 once the full month’s MLS reporting closes. Subscribe to the Grant Hammond research newsletter for monthly market update delivery directly to email.
Sources and further reading
- RealTracs MLS May 2026 Market Report covering the ten-county Greater Nashville MLS area
- RealTracs MLS Average Sale Price by County trailing twelve months from May 2025 through May 2026
- Freddie Mac Primary Mortgage Market Survey for rate environment context, weekly updates here
- Prior month context: Middle Tennessee Real Estate Market Update April 2026
- Prior month context: Middle Tennessee Real Estate Market Update March 2026
- Prior month context: Middle Tennessee Real Estate Market Update February 2026
- For STR investor positioning: Best Nashville Airbnb Buildings and the Nashville STR Zoning and Permits Guide