Nashville Real Estate Price Trend Analysis
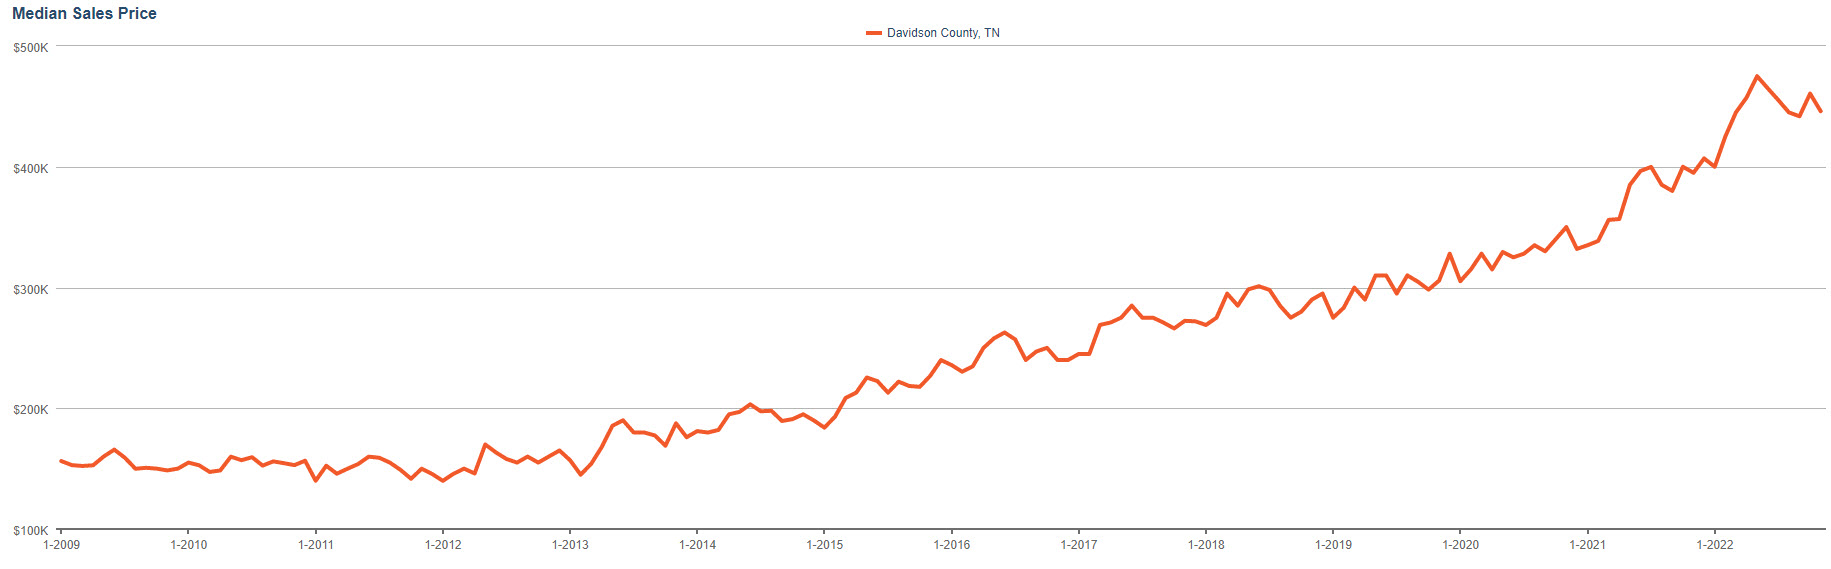
Let’s first talk about the biggest headline of the year: price. Median prices exceeded all expectations blasting through $475,000 in June of this year. It was a meteoric rise over $396,500 in 2021 and $325,000 in 2020. That’s a 46% increase in price over just 24 months. At no other time over the last 3 decades of data is that much of a increase found. We all know why this happened. Artificially low interest rates fueled purchases in an already undersupplied marketplace, but we’ll talk about supply later.
Nashville Mortgage Rate Trend Analysis
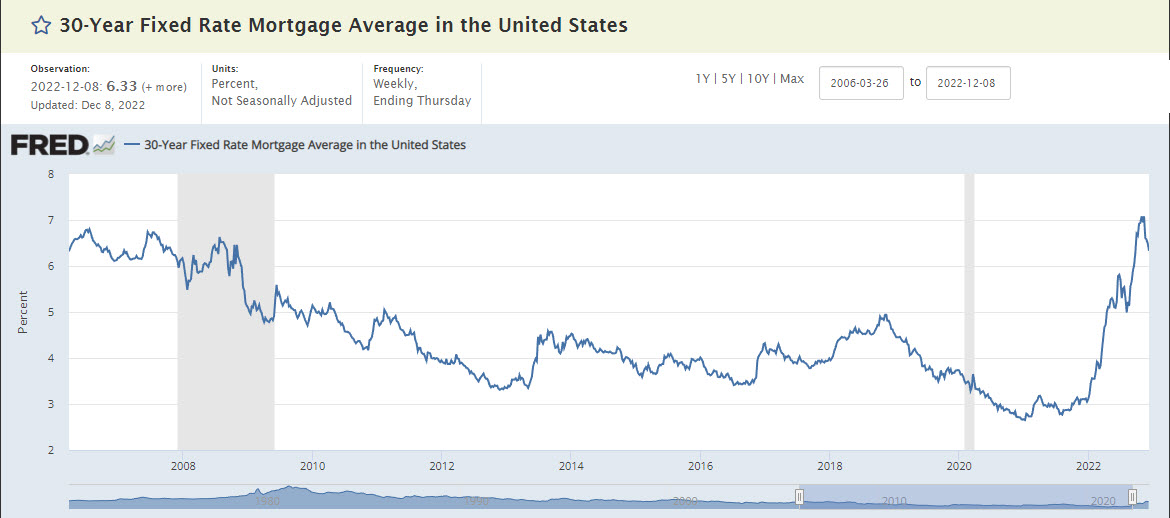
We accept that supply and demand move the price needle within the Nashville real estate market, but many forget just how much the demand side of the equation can be affected by mortgage interest rates. I’d make the argument that mortgage rates affect the demand side more than scarcity, but I do agree that those can be opposing forces. 16 years ago one can see that mortgage rates rose close to 7% prior to the Great Recession. Looking at the data at the time, we can extrapolate that once mortgage rates crossed 6.5%, given median household income ($62,254) and median price ($191,420), that most buying activity stopped in mid-2006.
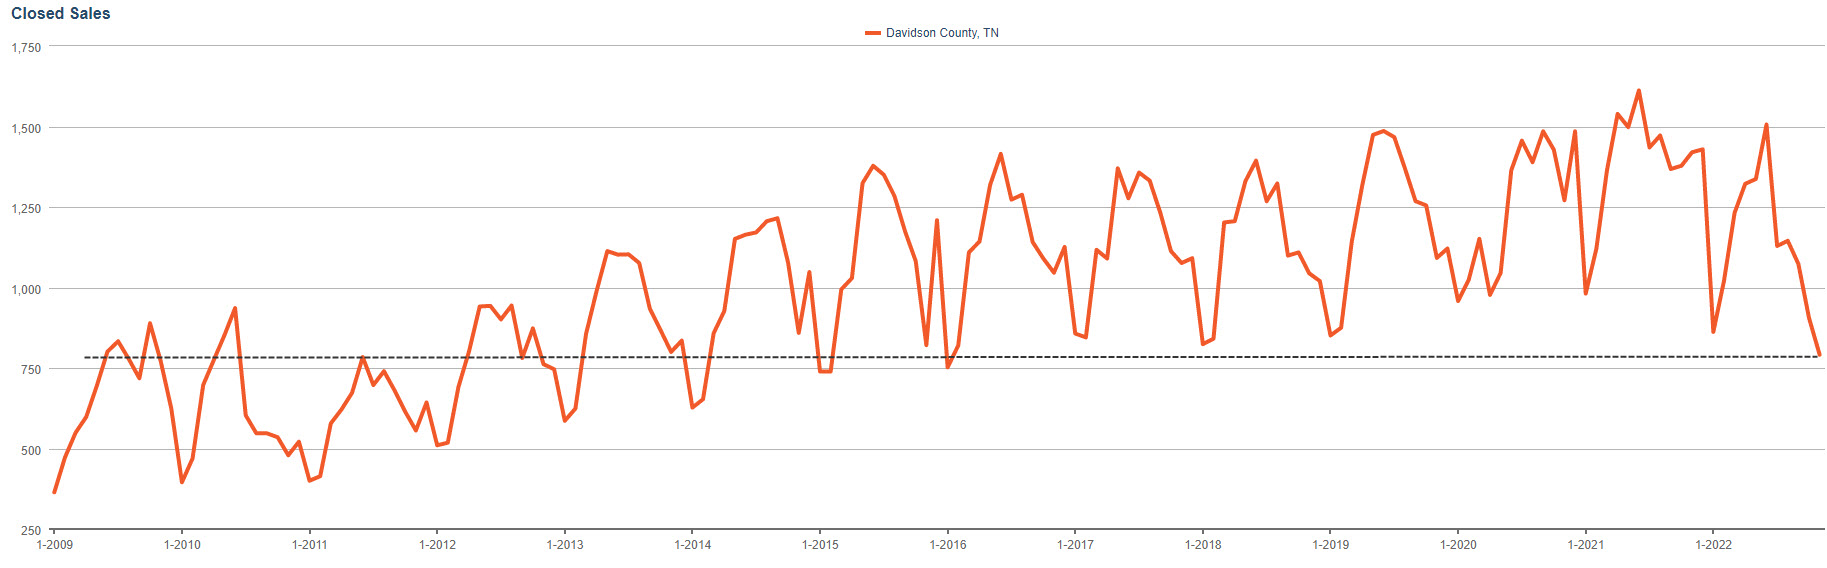
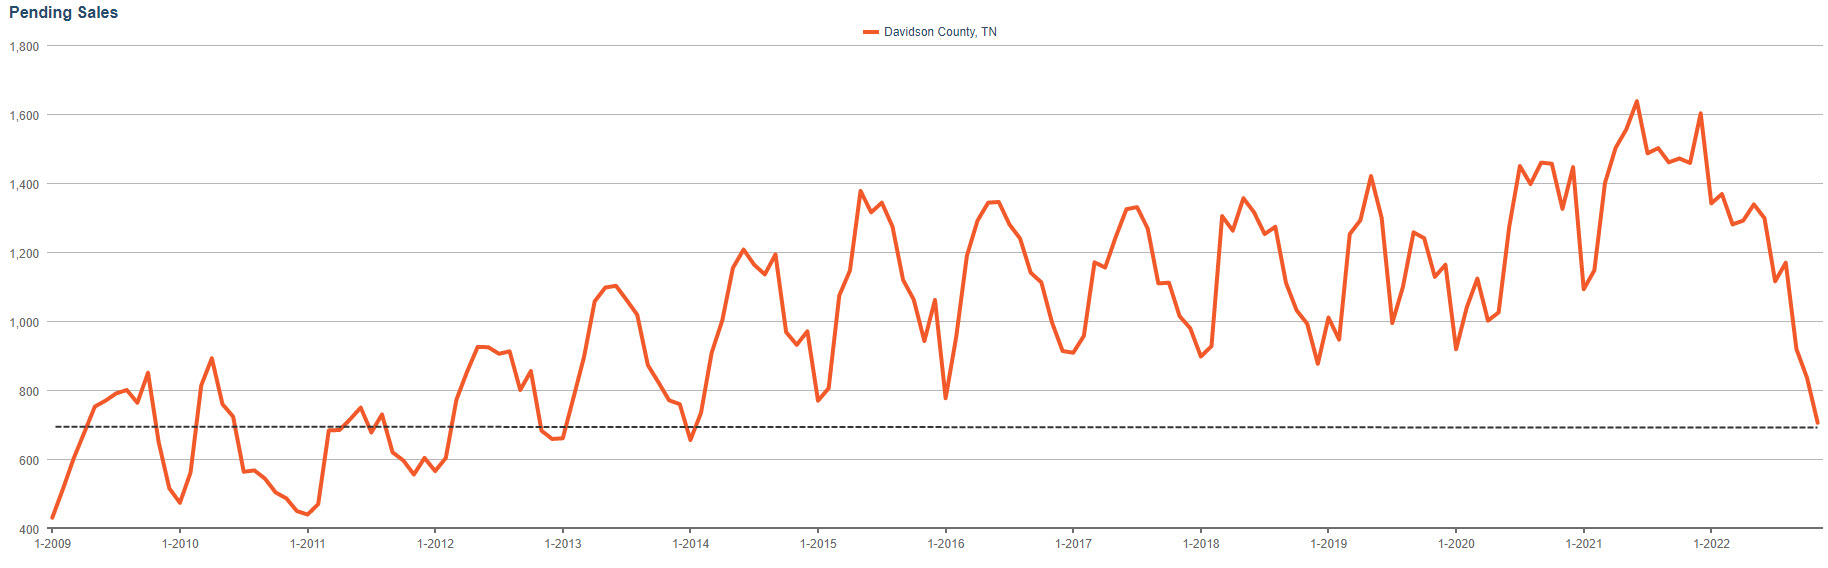
What Will Mortgage Interest Rates be in 2023?
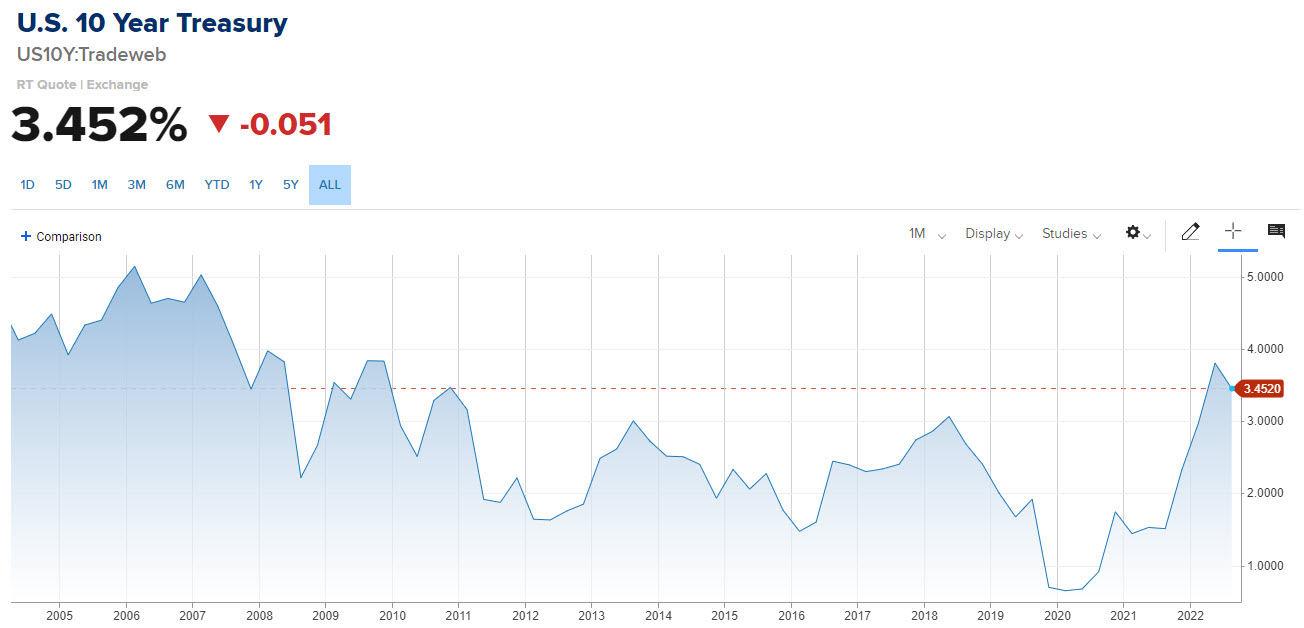
I’d argue that it’s highly likely Nashville mortgage interest rates will continue to fall. In fact, given the current 10 year Treasury hovering around 3.45, we might see interest rates much closer to those of 2010 – a year when the rates dipped into and stayed into the 4’s for the majority of the year. This doesn’t align perfectly with the more common {10 year Treasury + 1.8 = the 30 year mortgage rate in 2 weeks} math that we are accustomed to seeing, but it does align with a banking system that will become increasingly desperate for primary residence loan deal flow.
What about the Nashville Housing Supply?
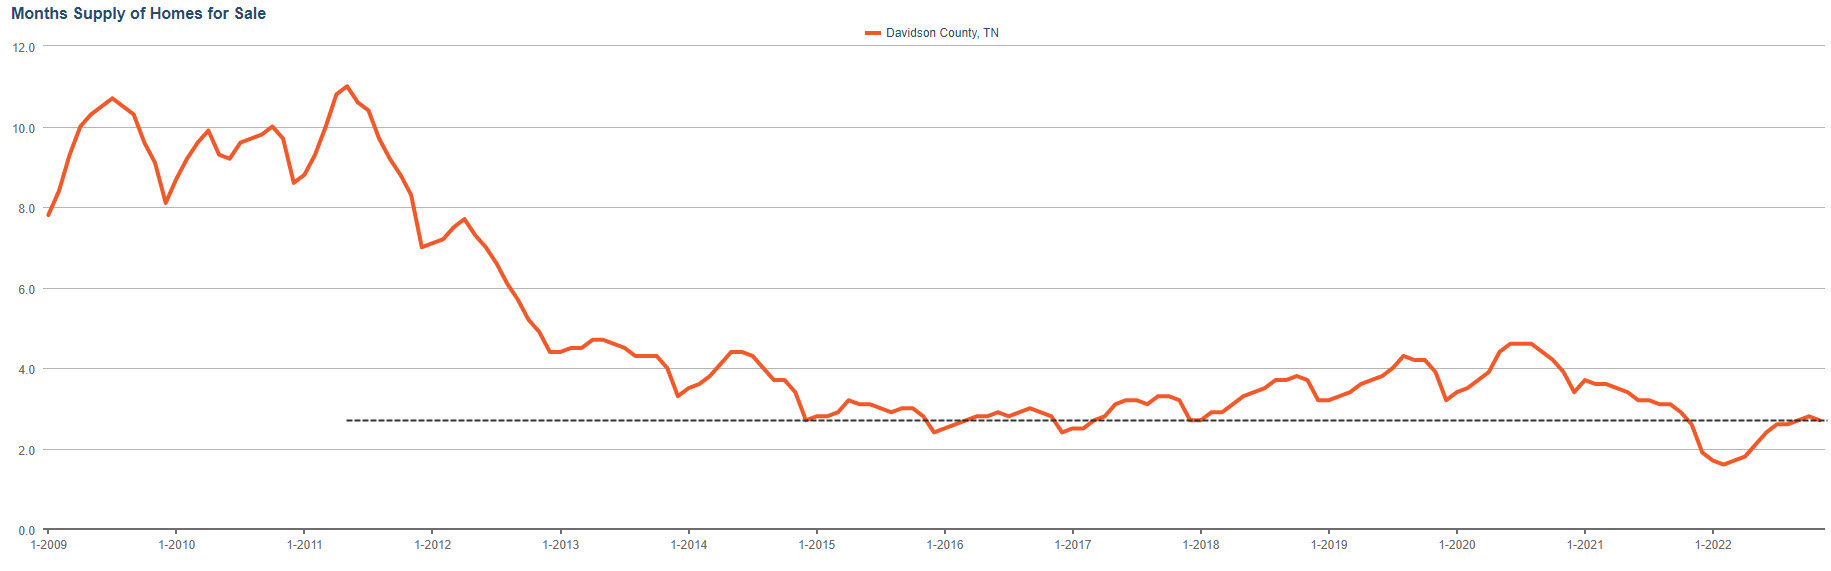
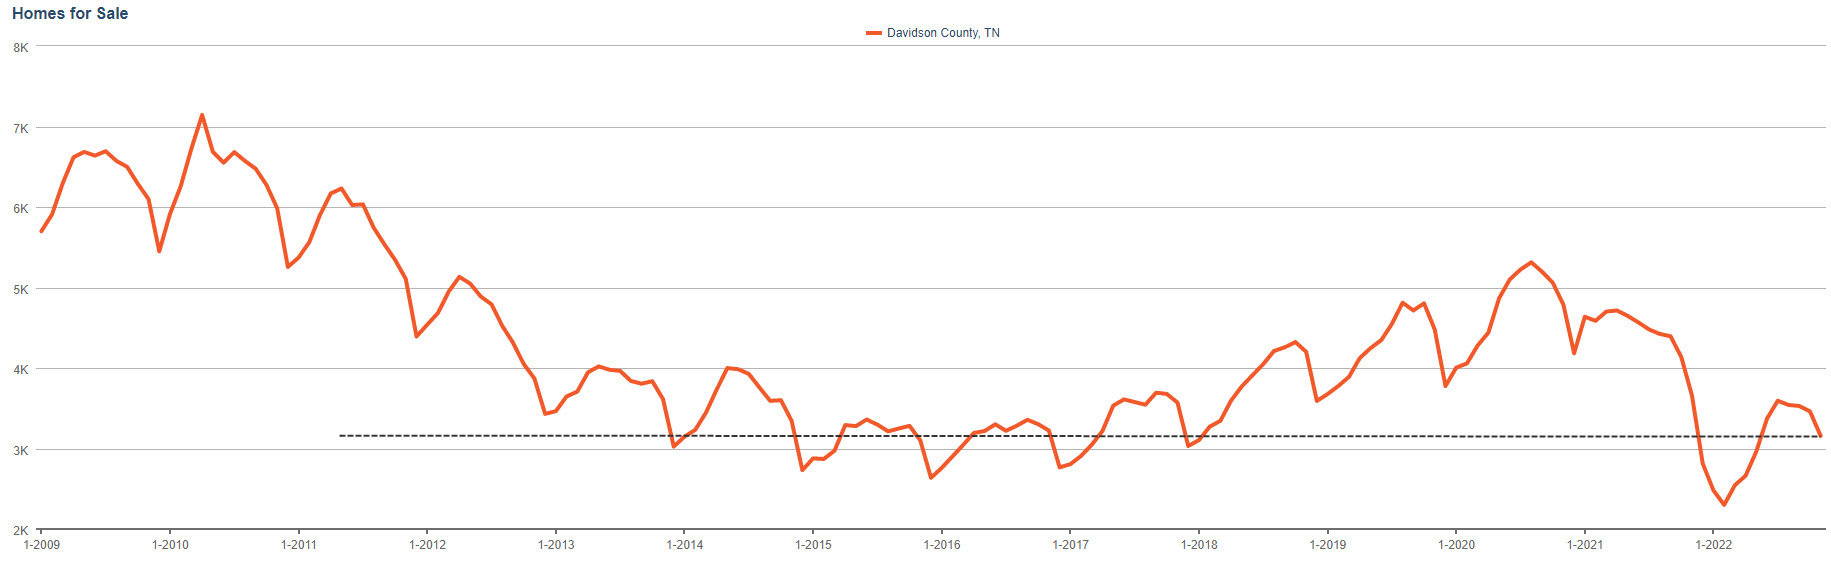
Let’s first agree that the entire country has been underbuilt since the Great Recession. Builders, developers and banks all pulled back as compared to the decade prior to the Great Recession. What’s more interesting to me is we roughly have the same number of homes for sale now as we did in November 2016 (3,223) before inventory levels began in inch up over a 5 year period. That entire 5 years’ worth of inventory growth was wiped out in the matter of 1.5 years and fell to an all-time low this century post pandemic shutdowns. This in turn pushed the months of housing supply below 2 months for the first time in measurable history.
What Happens with Nashville Home Prices in 2023
The math says Nashville homes prices should remain relatively flat. The more desirable areas may even appreciate a little while the less desirable areas depreciate a little. However, when I consider the FUD factor, I do think the less desirable areas will depreciate more than the math proves. This negative price action will bleed into the more desirable areas lowering my expectation from a little appreciation to flat. This is the falling tide theory. This leads me to conclude that the overall market will show price depreciation in 2023. How much? Well it’s difficult to say with any degree of certainly what value to assign to the FUD factor, but I’m going to assume a standard deviation factor of 1.12 (just an educated guess). This would predict the average median price falls 6.32% in 2023.
I think it’s important to note that my predictive analysis is rather static. You’d have to take into account hundreds of other factors in order to make a perfectly accurate prediction. Only Jerome Powell may have the real answer. However, I always find value in working through the examples above and I hope that you do to. Happy Holidays and see you soon!