This week gave us two markets for the price of one. Through Thursday, Nashville mortgage rates quietly improved while the bond market took a nap. Then Friday’s jobs report walked in, flipped over the table, and the Fed Funds Futures market went from pricing two rate cuts to pricing two hikes by next March. Same week. Same data. Different planet by 8:30 a.m. Friday.
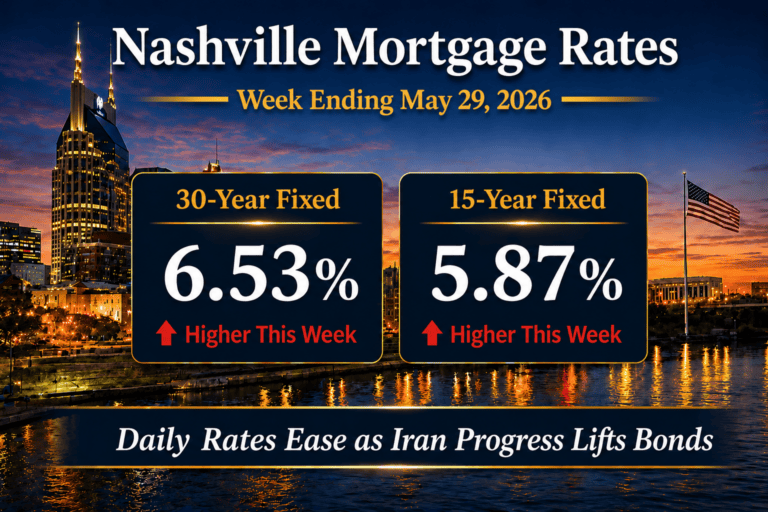
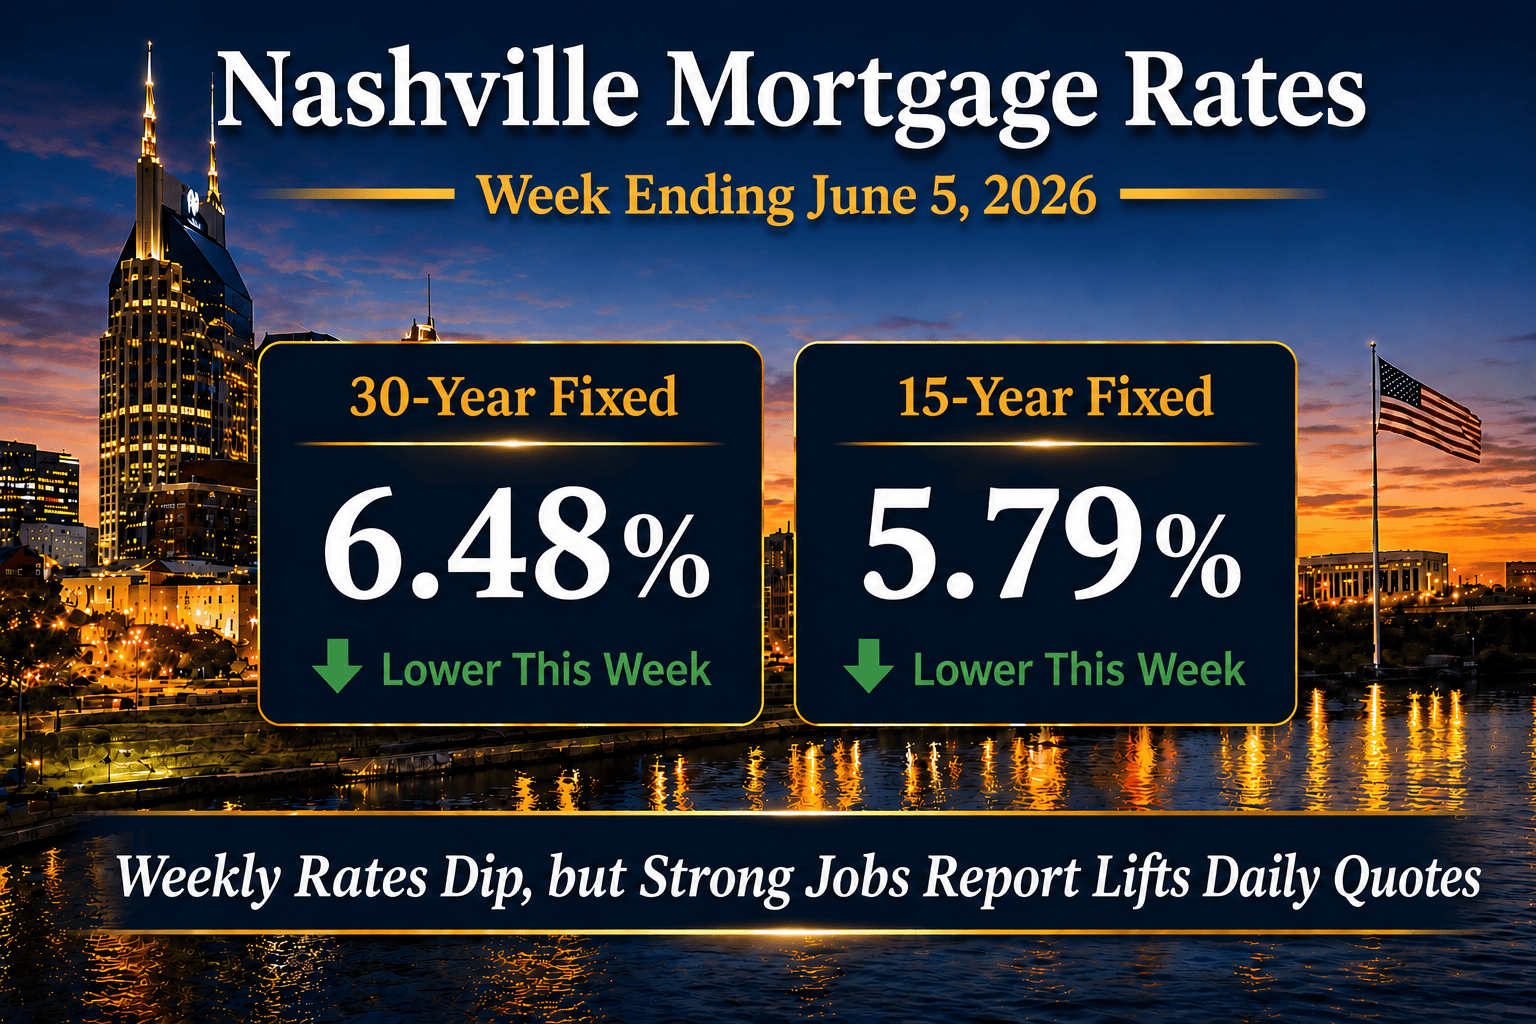
Here is where I land on it. The Freddie Mac 30-year fixed averaged 6.48% for the week ending June 5, 2026, down 5 basis points from 6.53%. The 15-year averaged 5.79%, down 8 basis points from 5.87%. Those are real numbers for buyers who locked early in the week. For anyone who floated into Friday, the live quote sheet looks closer to the mid-6.60s, because that 172,000-job print blew the doors off the 85,000 consensus and the bond market priced it accordingly. I will not pretend that surprise was anything but ugly for floating borrowers.
I keep a running weekly read on Nashville mortgage rates, so if you want the full arc instead of just this week’s snapshot, start with my Nashville mortgage rates tracker and come back every Friday.
In this report
Where Nashville mortgage rates landed this week
- Nashville 30-year fixed mortgage rate averaged 6.48%, down from 6.53% last week.
- Nashville 15-year fixed mortgage rate averaged 5.79%, down from 5.87% last week.
- FHA 30-year mortgage rates were near 6.18%.
- The 10-year Treasury yield ended the survey week near 4.47%, up 2 basis points, then climbed toward 4.55% Friday once the jobs report landed.
- Mortgage spreads tightened to 2.01%, or 201 bps, down from 208 bps the week before.
- Federal Reserve policy remained restrictive, with the Fed Funds rate at 3.50% to 3.75% under Chair Kevin Warsh and the next FOMC meeting set for June 16 to 17.
- MBA mortgage applications pulled back 8.5% in the latest Weekly Applications Survey.
According to Freddie Mac PMMS data released Thursday, June 4, 2026, this week’s declines reversed most of the prior two weeks’ increases and dropped the 30-year back into the middle of its 8-week range.
Mortgage Rate Dashboard
The dashboard reads 6.48% on the 30-year fixed, 5.79% on the 15-year fixed, an FHA 30-year near 6.18%, a 10-year Treasury yield near 4.47%, and a mortgage spread near 2.01%.
Nashville mortgage rates this week, in plain English
For the week ending June 5, 2026, the 30-year fixed averaged 6.48%, down 5 basis points from 6.53%. The 15-year averaged 5.79%, down 8 basis points from 5.87%. Year over year, the 30-year sits 41 basis points below the 6.89% print from the same week in 2025. The 15-year sits 24 basis points below the year-ago reading. So borrowers today are paying meaningfully less than borrowers a year ago, even when daily quotes feel sticky.
The survey’s 5-basis-point dip undersells how much the ground shifted late in the week. Through Thursday, mortgage spreads tightened from 208 to roughly 201 basis points while the 10-year edged up only 2 basis points to 4.47%. So this week’s improvement was a mortgage-market story, not a Treasury-rally story. Then Friday happened. The May Employment Situation report printed 172,000 jobs against an 85,000 consensus, and upward revisions lifted March from 178,000 to 214,000 and April from 115,000 to 179,000. Fed Funds Futures swung from pricing two cuts by next March to pricing two hikes, a full one-percentage-point repricing in roughly four hours. I have watched a lot of jobs Fridays. That one was theatrical.
For Middle Tennessee buyers, the practical read is timing. The 6.48% was real for borrowers who locked Monday through Thursday. Anyone floating into Friday saw quotes reset toward the mid-6.60s. Across Davidson and Williamson Counties in the middle of an active summer contract season, the gap between Freddie Mac’s published average and the live quote on your loan officer’s screen is wider than usual right now.
Institutional Macro Snapshot
What moved Nashville mortgage rates this week?
Three forces set the tape, and their ranking flipped on Friday morning. Spreads and a quiet bond market drove the survey improvement. Then one jobs report rewrote the Fed outlook. This follows the pattern from last week’s Nashville mortgage rate update, where a 10-year reversal pulled rates down while spreads worked against borrowers. Same melody, different instruments.
1. Treasury yields are still setting the floor
The 10-year Treasury held near 4.47% through Thursday, up only 2 basis points on the week and still beneath the 4.60% ceiling that has held for almost two decades. Friday broke the calm. The May jobs report pushed the 10-year toward 4.55% intraday as the market repriced the Fed, and that move flows into next week’s survey, not this one. The encouraging piece, if you want one, is that the 10-year has repeatedly failed to hold above 4.60% three months out over the last twenty years. It is below that line today.
2. Mortgage spreads finally did some work for borrowers
Spreads tightened from 208 to roughly 201 basis points during the survey week, which is the only reason the 30-year fell 5 basis points while the 10-year crept higher. When the mortgage-backed-securities market gets more comfortable with prepayment and credit risk, more of any rate improvement reaches borrowers without help from Treasuries. If the spread keeps grinding toward 190 bps, Nashville mortgage rates will outperform the bond market. Friday’s volatility is the obvious risk to that path.
3. Federal Reserve policy is keeping the rate floor elevated
The Fed Funds rate sits at 3.50% to 3.75%, restrictive, with Kevin Warsh chairing his first full FOMC meeting June 16 to 17 alongside an updated Summary of Economic Projections. Before Friday, the question was how soon the Iran war’s inflation risk would let the Fed cut. After Friday, futures were pricing two hikes by next March. JOLTS openings at 7.618 million and a stronger ADP print reinforced the read that the labor market is on firm footing, which keeps the floor elevated regardless of geopolitics.
The 10-year Treasury and Nashville mortgage rate spreads
The 10-year Treasury yield spent the survey week in a narrow band, closing near 4.47% Thursday, up just 2 basis points from the prior Friday. The quiet ended Friday morning when the May jobs report came in stronger than expected and the 10-year moved toward 4.55% intraday. That selloff lands in next week’s survey window, not this one.
This week the spread was approximately 2.01%, based on a 6.48% Freddie Mac 30-year fixed rate and a 4.47% 10-year Treasury yield. That is 201 basis points, tightening 7 basis points from last week’s 208. Mortgage Spread = 30-Year Fixed Mortgage Rate minus 10-Year Treasury Yield. When the spread tightens while Treasury yields hold flat, mortgage borrowers improve without help from the bond market. That is exactly what happened this week.
Last week, roughly 4 of 13 Treasury basis points reached borrowers because spreads widened against them. This week the spread did the opposite, giving back 7 basis points and letting the 30-year fall even as the 10-year edged higher. The question is whether that 201-basis-point level holds through the June 16 to 17 FOMC. If Friday’s bond selloff drags spreads wider again, the survey improvement will not survive into next week’s print.
Payment impact for Nashville buyers
On a $500,000 Middle Tennessee purchase with 20% down, the $400,000 loan at this week’s 6.48% average prices at approximately $2,523 per month in principal and interest, before taxes, insurance, and HOA. The same loan at last week’s 6.53% priced near $2,536. So this week saves about $13 per month, or roughly $4,700 over a 30-year term. Against the year-ago 6.89%, that same loan would have priced near $2,632, about $109 per month higher than today.
At the $1,000,000 price point common in Green Hills, Brentwood, and Franklin, an $800,000 loan at 6.48% prices at approximately $5,046 per month. That is about $26 per month below last week’s $5,072 and roughly $217 per month below the $5,263 a buyer would have locked at the year-ago 6.89%. Payment math uses standard 30-year amortization with no points and no escrow.
For East Nashville buyers in the $400,000 to $600,000 range, where DSCR-loan-driven investor demand competes with primary-residence buyers, this week’s spread tightening matters more than the headline rate. Investment-property pricing keys off the spread, and a 7-basis-point improvement narrows the gap that opened against DSCR products last week.
My playbook for borrowers in this market
A 6.48% 30-year in a range-bound market rewards preparation over prediction. The borrowers I see win in this environment are the ones with completed underwriting files who can lock inside a 24-hour window when pricing dips. The borrowers who wait for a headline rate that may not arrive are the ones who end up watching their target home go under contract to someone else.
- Buyers: This week’s survey was the best print since mid-May. With daily quotes resetting higher after Friday’s jobs report, I would not float into next week without a hard cap on the rate I am willing to tolerate.
- Sellers: Every 25-basis-point improvement widens the qualified buyer pool at your list price. With rates back in the middle of the 8-week range, pricing against the active comp set matters more than waiting for a rate-driven demand surge that may or may not show up.
- Investors: DSCR and investment-property pricing improved with the spread this week. If the spread holds near 201 bps or tightens further, the cost-of-capital gap that opened in late May closes over the next two to three weeks.
- Move-up buyers: In the $750K to $1.5M band, the rate on the new loan matters twice, once on the purchase and once against the rate you are giving up. At 6.48%, the carrying-cost delta on an $800,000 loan is roughly $217 per month cheaper than the same move a year ago. That is the comparison that actually drives the timing decision, not the headline number.
I have spent 25 years in Nashville real estate and closed over $1 billion across Davidson and Williamson Counties. That portfolio includes 100-plus luxury transactions above $1.5 million, 350-plus downtown Nashville high-rise condominium transactions, and 550-plus short-term rental transactions where financing structure was central to whether the deal closed. So when I say lock discipline matters more than rate-watching, I am not theorizing.
What I tell clients in a week like this is that the calendar matters as much as the rate. Locking ahead of a jobs report I cannot predict is rarely a mistake when the print can move quotes a tenth of a point in one morning. Friday delivered exactly that. I would rather a client capture a known 6.48% than float into a data release hoping for an eighth that may instead cost them a quarter.
Nashville real estate market outlook
The next two weeks are event-driven. Friday’s May Employment Situation report already landed stronger than expected, and the bond market’s first reaction was higher yields. The June 16 to 17 FOMC meeting follows, Kevin Warsh’s first as Chair with an updated Summary of Economic Projections. The next Employment Situation report arrives July 2 per the Bureau of Labor Statistics release schedule.
Next week is built around inflation. Both CPI and PPI release, and after Friday’s jobs strength the market will treat any upside surprise as confirmation that the Fed stays on hold or leans toward hikes. A soft CPI would do the most to repair the week’s damage, pulling the 10-year back toward the mid-4.40s and giving spreads room to keep tightening. A hot print pushes the 10-year toward the 4.60% ceiling and lifts the 30-year with it. The other live variable is the Iran war, where a confirmed peace deal would ease the oil-driven inflation premium that has anchored long-term rates near $90 oil. That remains the most plausible path to a meaningful drop.
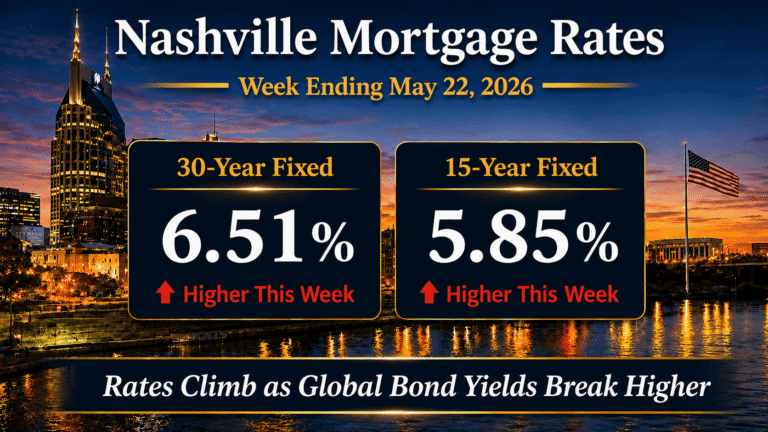
For Middle Tennessee, the payment-sensitive segments remain entry-level Davidson County buyers and the $400,000 to $600,000 investor band, while the $750K to $1.5M move-up segment responds more to direction than to level. For the longer arc of how rates traveled from the May highs to here, my May 22 Nashville mortgage rate analysis marks the top of the recent range at 6.51% and rising.
Nashville mortgage rates FAQ
What are Nashville mortgage rates today?
Nashville mortgage rates averaged 6.48% on the 30-year fixed and 5.79% on the 15-year fixed for the week ending June 5, 2026, per Freddie Mac PMMS. FHA 30-year quotes were near 6.18%. The 10-year Treasury yield closed near 4.47% Thursday and the mortgage spread sat near 201 basis points.
Did Nashville mortgage rates go up or down this week?
The survey average fell. The Freddie Mac 30-year dropped 5 basis points from 6.53% to 6.48%, and the 15-year dropped 8 basis points from 5.87% to 5.79%. Daily quotes jumped to two-week highs Friday after a strong May jobs report, so borrowers locking early in the week captured the best pricing.
Why did Nashville mortgage rates move this week?
Mortgage spreads tightened from 208 basis points to roughly 201 basis points while the 10-year Treasury barely moved, which let the survey rate improve without a bond rally. The week’s headline driver was Friday’s May jobs report, which printed 172,000 against an 85,000 forecast and, with upward revisions to March and April, swung Fed rate expectations toward potential hikes.
How does the 10-year Treasury affect Nashville mortgage rates?
The 10-year Treasury is the single most important benchmark for 30-year mortgage rate direction, and Nashville mortgage rates typically follow its moves with a one-to-two-day lag. The gap between the two is the mortgage spread, which sat near 201 basis points this week, tighter than the 208-basis-point reading a week ago. A tighter spread means more of any Treasury improvement passes through to borrowers.
Are Nashville mortgage rates expected to fall in 2026?
My base case for the next four to eight weeks remains range-bound, roughly 6.30% to 6.60% on the 30-year, with next week’s CPI and PPI prints and the June 16 to 17 FOMC meeting as the likeliest catalysts in either direction. Year over year, the 30-year is already 41 basis points lower. A sustained move below the range needs either softer inflation or an Iran peace deal, neither of which this week delivered.
Should Nashville buyers wait for lower mortgage rates?
Waiting carries two costs. This week’s 6.48% is the best print since mid-May, and Friday’s strong jobs report tilted near-term risk toward higher quotes. On a $400,000 loan, the difference between locking at 6.48% and floating back to 6.53% is about $13 per month, while losing a preferred property to competition has no refinance option later. Buyers with completed files who can lock on dips hold the advantage in this market.
Sources and methodology
Data sources (all retrieved June 5, 2026):
- Freddie Mac Primary Mortgage Market Survey (PMMS): freddiemac.com/pmms
- Federal Reserve Economic Data (FRED) DGS10, 10-Year Treasury Constant Maturity: fred.stlouisfed.org/series/DGS10
- Mortgage News Daily Mortgage Rate Index: mortgagenewsdaily.com/mortgage-rates
- Federal Reserve FOMC Meeting Calendar: federalreserve.gov/monetarypolicy/fomccalendars.htm
- Bureau of Labor Statistics, Employment Situation release schedule: bls.gov/schedule/news_release/empsit.htm
- Bureau of Labor Statistics, Consumer Price Index (April 2026 release, Core CPI YoY): bls.gov/cpi
- Mortgage Bankers Association Weekly Applications Survey: mba.org Weekly Applications Survey
- Federal Reserve H.15 Selected Interest Rates: federalreserve.gov/releases/h15
Methodology. Rate data in this update reflects weekly averages from the Freddie Mac Primary Mortgage Market Survey (PMMS) for the week ending June 5, 2026. Daily lender pricing context is sourced from the Mortgage News Daily Mortgage Rate Index. Macro indicators including the 10-year Treasury yield reference Federal Reserve Economic Data (FRED) series DGS10. Spread analysis between Nashville mortgage rates and the 10-year Treasury uses the historical PMMS minus DGS10 series. Payment math examples use standard 30-year fixed amortization on the cited principal balance with no points, no PMI, and no escrow. Actual loan pricing varies by credit profile, debt-to-income ratio, loan-to-value ratio, property type, and lender. The Macro Score is my proprietary read on five inputs (10-year direction, mortgage spread direction, inflation trajectory, Fed policy stance, geopolitical premium) and is not a standardized industry metric. Year-over-year comparisons reference the same Freddie Mac PMMS week from the prior year.
About the broker. I am Grant Hammond, a Nashville real estate broker at Compass RE with 25 years of Middle Tennessee brokerage, over $1 billion in career closings, 550-plus short-term rental transactions, and 350-plus downtown Nashville high-rise condo transactions.
Commission and compensation disclosure
Broker fees are not set by law and are fully negotiable. All commission and buyer-agency details should be discussed before contract.
Forward-looking statement disclosure
This post contains forward-looking statements about interest rates, Federal Reserve policy, and housing market conditions. These statements reflect my analysis as of June 5, 2026, and actual outcomes may differ materially. Mortgage rates change daily. The rates referenced above are the Freddie Mac PMMS weekly average for the week ending June 5, 2026. Daily lender quotes will differ based on credit profile, loan size, property type, and lock period. Nothing in this analysis constitutes a rate lock guarantee or a commitment to lend. Speak with a licensed mortgage professional for personalized pricing.
More Nashville mortgage analysis
I publish new Nashville mortgage rates analysis every Friday at 4:00 PM Central. For current weekly data and the live dashboard, visit the weekly Nashville financing trends hub. For prior weekly reads, browse the Mortgage Rates and Financing archive.