Across the last six months, 978 homes have closed in Franklin at a median price of $949,995, and the number that explains the most about this market is the one sitting right next to it: 475,000. That is the median closed price in Davidson County over the same window. Franklin trades at roughly twice the Davidson County median, and the reason is not mystery, it is supply. Williamson County is still delivering new construction at a scale that built-out Davidson submarkets structurally cannot, and most of that new inventory is larger, newer, and priced accordingly.
Franklin single-family: a buyer's market as of 08-10-2026. About 7.1 months of supply, 99% sale-to-list.
| Active listings | 1,011 |
|---|---|
| Median list price | $1,299,950 |
| Median $/sqft (list) | $376 |
| Median days on market | 40 days |
| Homes closed (24-mo) | 3,307 |
| Median closed price | $1,052,441 |
| Average closed price | $1,323,116 |
| Median closed $/sqft | $343 |
| Top recent closed sale | $35,000,000 (998 Dickinson Ln, 5,488 sq ft, $6,378/sq ft) |
| Sale-to-list | 99% |
| Months of supply | 7.1 |
| Top active listing | $35,900,000 (5284 Poor House Hollow Rd, 2,490 sq ft) |
| ZIP | 37064 / 37067 / 37069 |
As of (1,011 active listings). Source: RealTracs via IDX. Analysis by Grant Hammond.
What's your Franklin home worth? Get a free local valuation →
If you are tracking Franklin TN home prices, start with my Franklin homes overview for live inventory. This post is the closed-data companion to that page, the part that tells you what buyers paid rather than what sellers are asking, and a read worth putting next to my Nashville housing market analysis across the rest of the metro.
What do Franklin TN home prices look like right now?
Across the trailing six months, 978 homes settled in Franklin at a median closed price of $949,995 and a median of $345 per square foot, at a median sale-to-list ratio of 98.7%. The middle half of those sales ran from about $700,000 to $1.41 million. The full range stretched from $190,000 to $35 million, but the top end is a handful of estate and acreage sales that pull the average up to roughly $1.3 million while the median holds near $950,000. Here is how the closings distribute by price band.
How do Franklin TN home prices break down by ZIP?
Franklin runs across three primary ZIP codes, and they do not trade as one market. The 37064 ZIP carried about two-thirds of the volume; 37069 holds the larger-acreage and estate parcels; 37067 skews toward established subdivisions and townhomes.
The ZIP is a starting filter, not an answer. The parcel, the subdivision, the build year, and the lot do most of the work inside each ZIP. Two homes in 37064 a mile apart can sit a quarter-million dollars apart on lot size and finish alone.
How does new-construction supply shape the Franklin market?
This is the structural feature that separates Williamson County from Davidson. Franklin’s highest-volume subdivisions are overwhelmingly new construction, and the build years show it. Many new-construction subdivisions show a median days-on-market near zero because the homes sell at or before completion; established resale pockets such as Westhaven run longer.
A seller of an existing Franklin home is often competing against a builder down the road who can offer a rate buydown, a finish allowance, or a quick-delivery spec home. When I price a Franklin resale, that builder concession stack is part of the comparison, because it resets the effective number my seller has to beat.
How does Franklin compare to Brentwood right now?
Brentwood is the natural Williamson County comparison. The two trade at nearly identical price per square foot; the difference in median is house and lot, not finish quality. Brentwood sits closer to Nashville with a larger share of bigger homes on bigger lots.
The same budget buys more square footage and newer construction in Franklin than in Brentwood, with a longer commute corridor as the tradeoff. The companion read on the Brentwood market breaks that submarket down the same way. Talk through which submarket fits your budget in a 15-minute call.
How does Williamson County sit against Davidson County?
At the county level the supply story gets clearer. Davidson moves nearly twice the volume because it is a far larger, denser market, but it trades at roughly half the Williamson median because its housing stock is older, smaller, and on tighter lots, and built-out Davidson neighborhoods cannot add new supply the way Williamson subdivisions can.
In 25 years brokering Middle Tennessee, that pattern has held through every cycle. The durable characteristics that hold demand in Franklin are lot size, the commute corridor north along I-65 toward the Nashville and Cool Springs employment cores, and the school attendance-zone boundaries that buyers verify per parcel. I treat the zone line the way I treat lot size or flood designation, as a documented characteristic of the parcel you confirm before you write, never as a quality or suitability claim.
What is on the market in Franklin right now?
Closed data tells you what buyers paid; live listings tell you what they can buy today. Here is the current active inventory across Franklin, pulled straight from the MLS and updated as new homes hit the market.
- List View
- Map View
- Grid View
-
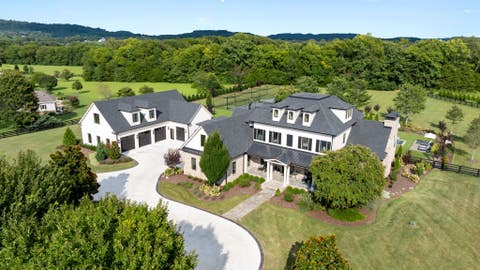
 $8,499,999
-
Lot Size5.01 ac
-
Home Size9,500 sqft
-
Beds5 Beds
-
Baths6.5 Baths
-
Year Built2005
-
-
 $2,374,900
-
Lot Size1.05 ac
-
Home Size6,286 sqft
-
Beds5 Beds
-
Baths4.5 Baths
-
Year Built2002
-
-
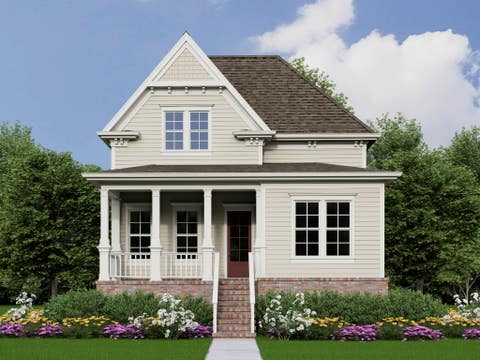 $1,437,544
-
Lot Size
-
Home Size2,882 sqft
-
Beds4 Beds
-
Baths4 Baths
-
Year Built2026
-
-
 $1,918,549
-
Lot Size9,584 sqft
-
Home Size3,620 sqft
-
Beds4 Beds
-
Baths4.5 Baths
-
Year Built2026
-
-
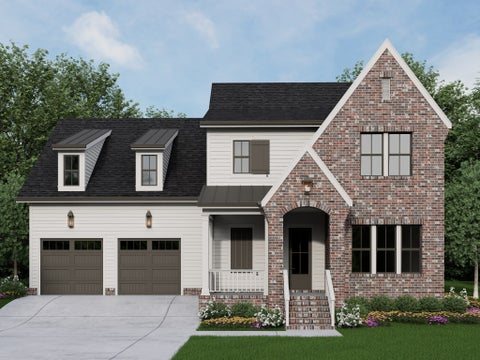 $1,923,100
-
Lot Size
-
Home Size3,650 sqft
-
Beds4 Beds
-
Baths4.5 Baths
-
Year Built2026
-
-
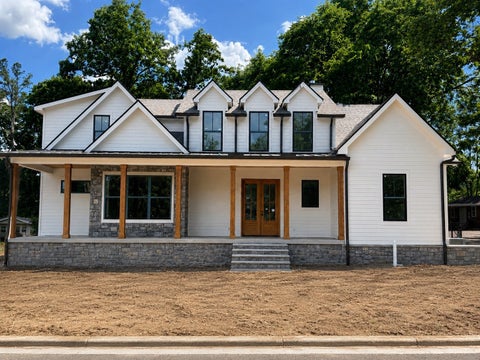 $2,299,900
-
Lot Size21,780 sqft
-
Home Size4,010 sqft
-
Beds4 Beds
-
Baths3.5 Baths
-
Year Built2026
-
-
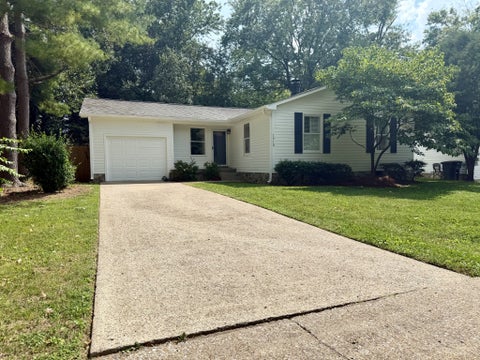 $535,000
-
Lot Size6,099 sqft
-
Home Size1,242 sqft
-
Beds3 Beds
-
Baths2 Baths
-
Year Built1979
-
-
 $849,750
-
Lot Size5,663 sqft
-
Home Size2,931 sqft
-
Beds4 Beds
-
Baths3.5 Baths
-
Year Built2017
-
-
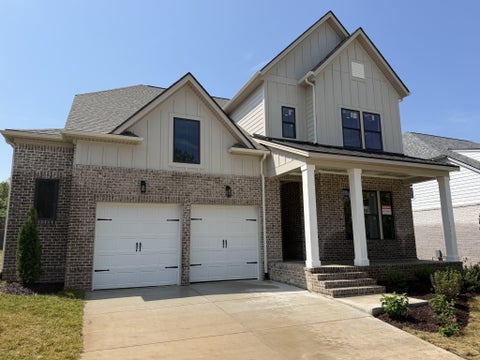 $999,900
-
Lot Size7,841 sqft
-
Home Size2,970 sqft
-
Beds5 Beds
-
Baths4 Baths
-
Year Built2026
-
-
 $999,000
-
Lot Size9,584 sqft
-
Home Size3,162 sqft
-
Beds4 Beds
-
Baths3 Baths
-
Year Built2023
-
-
 $3,090,989
-
Lot Size10.23 ac
-
Home Size5,050 sqft
-
Beds5 Beds
-
Baths5.5 Baths
-
Year Built2026
-
-
 $822,570
-
Lot Size4,792 sqft
-
Home Size2,816 sqft
-
Beds4 Beds
-
Baths3 Baths
-
Year Built2027
-
-
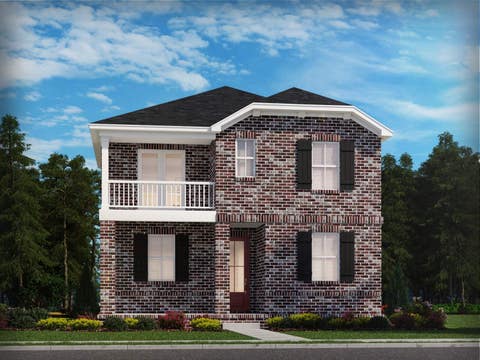 $828,470
-
Lot Size4,792 sqft
-
Home Size2,816 sqft
-
Beds4 Beds
-
Baths3 Baths
-
Year Built2027
-

See all Real estate matching your search.
(all data current as of
8/11/2026)
Listing information deemed reliable but not guaranteed. Read full disclaimer.
What am I watching in Franklin for the rest of the year?
Here is what I am watching. First, whether resale listings adjust price as new-construction concessions stay aggressive into the summer slowdown. Second, how the 37069 upper band behaves, since the estate and acreage segment trades in its own slower market. Third, whether the I-65 commute corridor keeps pulling Davidson-priced-out buyers south into Franklin and the outer Williamson towns, which would widen the volume gap further.
If you are weighing a move into Williamson County this summer, run the comparison against the neighboring submarkets before you commit. The same budget reads differently in Brentwood, where the commute is shorter and the median sits higher, or in Green Hills in Davidson County, where built-out streets cannot match Franklin’s new-construction supply. For the full metro picture, my running Nashville homes for sale page tracks every submarket I cover.
Book a 15-minute Franklin strategy call for my read on a specific street, subdivision, or build. A short conversation usually beats a weekend of filtering listings.
Frequently asked questions
How much does a home in Franklin, TN cost right now?
Over the trailing six months, 978 homes closed in Franklin at a median price of $949,995 and $345 per square foot, with the middle half of sales between roughly $700,000 and $1.41 million. The range runs from about $190,000 to $35 million, where a few estate and acreage sales pull the average well above the median.
Why are Franklin home prices so much higher than Nashville’s?
The difference is house and lot, not a premium on the same product. Franklin’s $949,995 median runs about double Davidson County’s $475,000 median because Williamson County’s housing stock is newer, larger, and on bigger lots, and the county is still delivering new-construction inventory that built-out Davidson neighborhoods cannot add. On price per square foot the gap narrows to $345 against $275.
Is new construction a better deal than resale in Franklin?
It depends on the concession stack. Builders in Franklin’s active subdivisions are often offering rate buydowns, finish allowances, or quick-delivery pricing, and many new-construction homes sell at or before completion. The right answer is a side-by-side comparison of the specific build against the specific resale, including the value of the concessions.
What is the difference between Franklin and Brentwood for buyers?
Both are Williamson County markets with similar price per square foot, $345 in Franklin against $346 in Brentwood, but Brentwood’s median closed price is higher, $1,320,000 against $949,995, because it carries larger homes on larger lots and sits closer to Nashville. Franklin offers a wider entry-to-mid range and more total inventory.
Sources, methodology, and disclosure
Data sources. Closed-sale counts, medians, price-per-square-foot, ZIP and price-band breakdowns, and the sale-to-list ratio reference the Grant Hammond market engine trailing six-month closed-sale dataset (imported June 25, 2026; 7,141 closed transactions across Davidson and Williamson Counties; Franklin n=978). Sale-to-list is the median of sale price divided by list price across those 978 closings (98.7%). Months of supply is active listings (995, RealTracs via IDX, June 25, 2026) divided by the trailing-six-month pace of about 163 closings per month (about 6.1 months). Per-subdivision build-year and days-on-market figures, and the Brentwood comparison, reference the RealTracs MLS May 2026 trailing-window pull. Median is used as the headline statistic because a small number of high-value estate sales distort the average. All figures are derived from these datasets; no values are estimated or invented.
Broker authority. Verified broker authority used: 25 years of Middle Tennessee brokerage and over $1 billion in career closings across Davidson and Williamson Counties.
Commission disclosure. Broker fees are not set by law and are fully negotiable. All commission and buyer-agency details should be discussed before contract.
Compliance disclaimer. This post is informational and is not legal, tax, or investment advice. Market data is a snapshot in time and changes weekly; specific pricing and timing decisions should be confirmed with current MLS data before listing or making an offer. School attendance-zone assignments are set and changed by Williamson County Schools and the Franklin Special School District and must be verified per parcel with the relevant district.