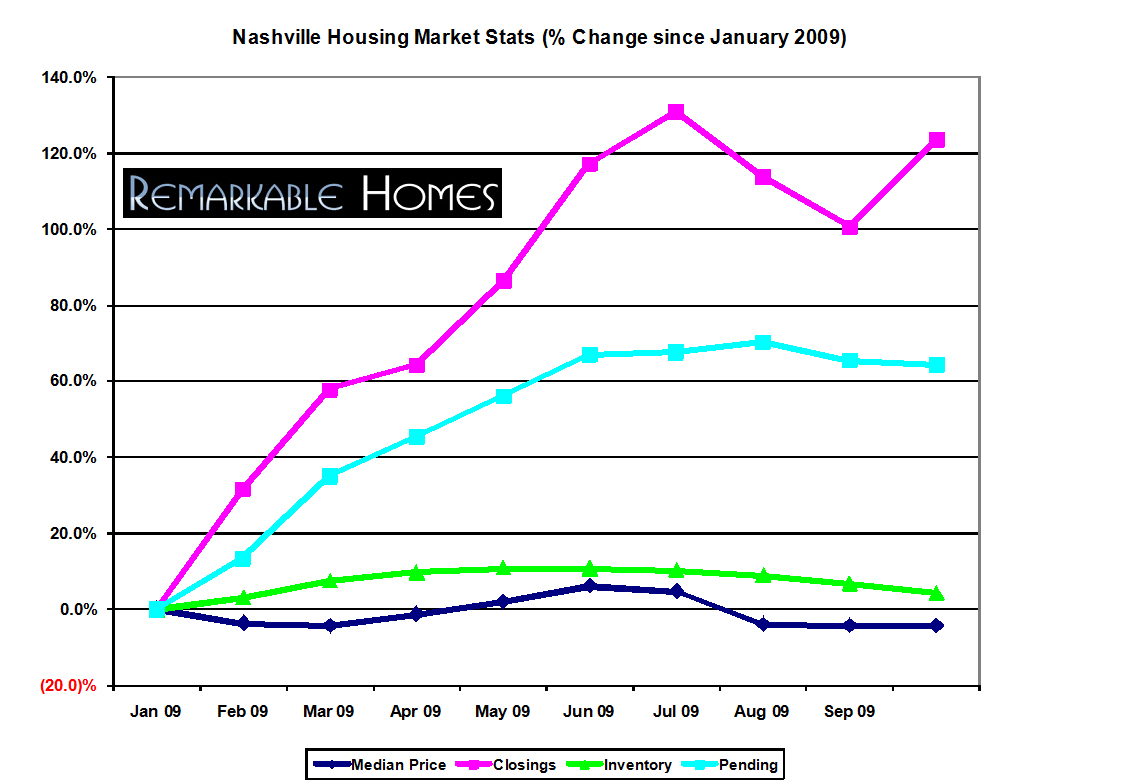
October 2009 Nashville real estate market analysis showed continued stabilization across several major housing indicators. Inventory declined, pending sales surged, and closings rebounded sharply compared to prior year levels.
While pricing remained under pressure, broader data suggested improving market health within the Nashville real estate market. The key question was whether these gains represented a sustainable recovery or temporary support from government stimulus.
Inventory Levels Continue to Improve
Total inventory declined 2.4% from September levels. Active inventory was now only 4.02% higher than January levels.
There were 16,575 active homes and condos on the market during October. That compares to 17,169 properties in October 2008, representing a year over year decline of 3.58%.
While shadow inventory remained a concern nationally, the visible MLS inventory trend continued moving in a healthier direction.
Pending Sales Remain Strong
Pending sales continued to show one of the strongest trends in the October 2009 Nashville real estate market analysis. Since January, pending sales increased 60.87%.
For the third consecutive month, pending sales exceeded prior year levels. October pending activity was 40% higher than October 2008.
This was particularly notable because it occurred during a period that normally experiences seasonal slowing.
The federal first-time homebuyer tax credit clearly played a major role in supporting transaction activity.
Closed Sales Rebound Sharply
After two months of declining closings, transaction volume rebounded strongly in October. Closings increased 11.34% from September.
Since January, total closings had increased 123.48%. Compared to October 2008, closings were up 19.61% year over year.
Just three months earlier, Nashville closings were running behind 2008 levels. This reversal represented a major improvement in transaction activity.
Median Prices Stabilize
Median pricing showed signs of stabilization after two months of accelerated declines. October median pricing came in at $157,761, nearly unchanged from September.
Year over year, prices were still down 6.41% compared to October 2008.
Part of this pressure came from first-time buyer activity and distressed sales. However, stronger demand for higher-quality distressed inventory helped reduce the pace of decline.
This pattern aligns with broader housing market trends, where transaction recovery often occurs before pricing fully stabilizes.
Months of Inventory Improve Further
Based on closed sales, Nashville held 8.03 months of inventory in October. Based on pending sales, the number improved slightly to 7.87 months.
This represented a significant improvement from October 2008, when inventory levels stood at 10.32 months.
Absorption trends improved throughout most of 2009 and pointed toward strengthening market conditions.
What the October Data Suggested
By late 2009, several indicators pointed toward improving market momentum. Inventory was falling, pending sales were increasing, and closings had rebounded strongly.
At the same time, pricing remained soft due to distressed inventory and fewer luxury transactions.
The extension and expansion of the federal tax credit, combined with historically low mortgage rates, created additional short-term support for the market.
Forward Outlook
The October data suggested that Nashville may have reached a market bottom during late summer or early fall of 2009.
However, questions still remained about the durability of the recovery once government support eventually faded.
Understanding how inventory, pricing, financing, and policy interact is essential for evaluating housing cycles. For more financing insights, explore Nashville mortgage rates and financing.



November 12, 2009, 8:56 am
November 12, 2009, 4:51 pm
This shocker today (11/12/2009) in the online Nashville Business Journal:
“Even more condo units will soon be sold at auction.
Forty-five units at John Coleman Hayes' The West End Luxury Condominiums will be sold at auction Dec. 5.
The condo tower, located at West End and 31st Avenue, features 72 units. Since opening in April 2008, five have sold.
Current list prices for the units range from $385,000 to $948,000. The auction will include five one-bedroom units, 25 two-bedroom units and 15 three-bedroom units.
The average square footage of offered units is 2,100 square feet.”
This ought to result in even lower bids at Terrazzo's auction on 11/21/2009, don't you think? With 75 high-quality condos being auctioned over the next three weeks, who in their right mind would pay what the developers of Velocity and Icon are currently charging? It looks like buyers who bought early on into these projects, as well as Terrazzo, got burned badly. Five sales in 18 months is simply astounding.
November 12, 2009, 8:08 pm
Doesnt sound like its the same market as the Terrazzo with prices like that. The LOW was $385k? No wonder they can't sell them.
November 12, 2009, 8:58 pm
When the Terrazzo auction was first announced, the Tennessean reported an investor had bought a one-bedroom unit, preconstruction, for $373,000. (Actually, the paper reported this investor had bought three units, but the prices of the other two units were not disclosed.) The West End units are far larger and more traditional than Terrazzo (and, depending on your taste, more upscale), but your point is well taken: the prices developers have been charging, and in some cases getting, far exceed the FMV of these properties.
November 12, 2009, 10:51 pm
This shocker today (11/12/2009) in the online Nashville Business Journal:
“Even more condo units will soon be sold at auction.
Forty-five units at John Coleman Hayes' The West End Luxury Condominiums will be sold at auction Dec. 5.
The condo tower, located at West End and 31st Avenue, features 72 units. Since opening in April 2008, five have sold.
Current list prices for the units range from $385,000 to $948,000. The auction will include five one-bedroom units, 25 two-bedroom units and 15 three-bedroom units.
The average square footage of offered units is 2,100 square feet.”
This ought to result in even lower bids at Terrazzo's auction on 11/21/2009, don't you think? With 75 high-quality condos being auctioned over the next three weeks, who in their right mind would pay what the developers of Velocity and Icon are currently charging? It looks like buyers who bought early on into these projects, as well as Terrazzo, got burned badly. Five sales in 18 months is simply astounding.
November 13, 2009, 2:08 am
Doesnt sound like its the same market as the Terrazzo with prices like that. The LOW was $385k? No wonder they can't sell them.
November 13, 2009, 2:58 am
When the Terrazzo auction was first announced, the Tennessean reported an investor had bought a one-bedroom unit, preconstruction, for $373,000. (Actually, the paper reported this investor had bought three units, but the prices of the other two units were not disclosed.) The West End units are far larger and more traditional than Terrazzo (and, depending on your taste, more upscale), but your point is well taken: the prices developers have been charging, and in some cases getting, far exceed the FMV of these properties.
November 16, 2009, 6:19 pm
December 1, 2009, 1:26 pm
May 5, 2010, 2:19 pm