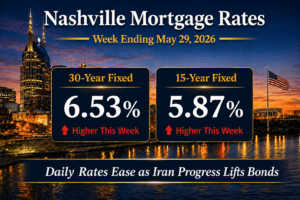
Nashville mortgage rates today: July 10, 2026
Nashville mortgage rates rose modestly for the week ending July 10, 2026: the 30-year fixed averaged 6.49% and the 15-year 5.82%, both...
Updated September 6, 2026 · 45 posts in this archive · 2007 to 2026 · 30-year mortgage rate analysis from Grant Hammond
Quick answer: 30-year mortgage rate analysis, week by week. Each entry reports the Freddie Mac survey rate for that week, the 10-year Treasury yield beside it, and the gap between them, then works the number through to a Nashville payment. Rates are stamped to the week they describe and never presented as a live quote.
30-year mortgage rate analysis from Grant Hammond, in date order. The 30-year fixed is the rate almost every Nashville buyer actually shops, which is why it gets its own archive rather than sitting inside general mortgage coverage. For the current picture, see Nashville mortgage rates today, or the full weekly Nashville mortgage rate archive.
The Freddie Mac survey rate for the week, the 10-year Treasury yield beside it, and the spread between them. Each entry says what moved the rate, whether an inflation print, a Treasury auction, or a change in what the market expects from Federal Reserve policy. Then it converts the move into a monthly payment difference at Middle Tennessee price points, because a quarter point means something different at $400K than at $1.5M.
Because a lender takes on risks the government does not. A mortgage can be prepaid at any time, which makes its real life span unpredictable, and it carries credit risk that a Treasury does not. Investors buying mortgage-backed securities want paying for both, and that premium is the spread. It is not a fixed number. It widens when lenders turn cautious or demand for mortgage bonds thins, and narrows when the opposite happens. That is why the 30-year fixed can move in a week when the Treasury barely does, and why watching the Treasury on its own will mislead you.
Davidson County and Williamson County, across price bands from under $500K through $2.5M and above. Each entry addresses the buyer profiles that behave differently as rates move: first purchase, move up, and investment.
Grant Hammond is a Nashville real estate broker at Compass RE. He has 25 years of experience and over $1 billion in career sales across Davidson and Williamson Counties. Furthermore, his market analysis appears regularly in major publications, including the Wall Street Journal, the Los Angeles Times, The Tennessean, and the Nashville Business Journal. Tennessee Real Estate Broker License #261980.