January Jobs Data and What It Means for Nashville Real Estate
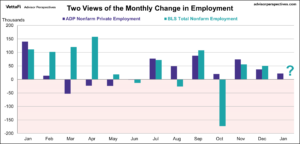
January’s ADP report showed only 22,000 private sector jobs added, reinforcing signs of a K-shaped economy. Higher-income households remain insulated while middle-class...
Nashville housing demand coverage from Grant Hammond, broker at Compass RE with 25 years of Middle Tennessee market reporting. This archive collects every Nashville housing demand post, organized chronologically. Each post tracks pending sales activity, showing traffic, multiple-offer patterns, and the demand-side dynamics that move Nashville prices. Additionally, every post analyzes drivers including mortgage rates, in-migration, and corporate relocations.
This archive is the historical reference for Nashville housing demand coverage. Demand metrics paired with inventory data forecast the next several months of price direction.
Every Nashville housing demand post covers the same data points consistently. It provides pending sales activity by submarket. Then it analyzes multiple-offer patterns and showing-to-offer ratios. Additionally, every post features the buyer profile mix. Furthermore, every analysis closes with implications for the next several months of price direction.
Nashville housing demand coverage matters because demand-side data leads price movements by 30 to 60 days. Specifically, pending sales activity is the most forward-looking single metric. These factors include relocation buyer share, investor share, and first-time buyer share. Additionally, demand mix varies meaningfully by Nashville submarket.
Every Nashville housing demand post covers Davidson and Williamson Counties. Specifically, the coverage includes Brentwood, Franklin, Belle Meade, Green Hills, East Nashville, The Gulch, Downtown Nashville, Germantown, Hendersonville, and Spring Hill. Additionally, the analysis tracks demand across price bands.
Grant Hammond is a Nashville real estate broker at Compass RE. He has 25 years of experience and over $1 billion in career sales. Furthermore, his market analysis appears regularly in the Wall Street Journal, the Los Angeles Times, The Tennessean, and the Nashville Business Journal. Grant Hammond holds Tennessee Real Estate Broker License #261980.